. 2011 Dec 25;8(2):185-96.
doi: 10.1038/nchembio.763.

Small-molecule proteostasis regulators for protein conformational diseases

Affiliations

Small-molecule proteostasis regulators for protein conformational diseases

Barbara Calamini et al. Nat Chem Biol. .

Abstract

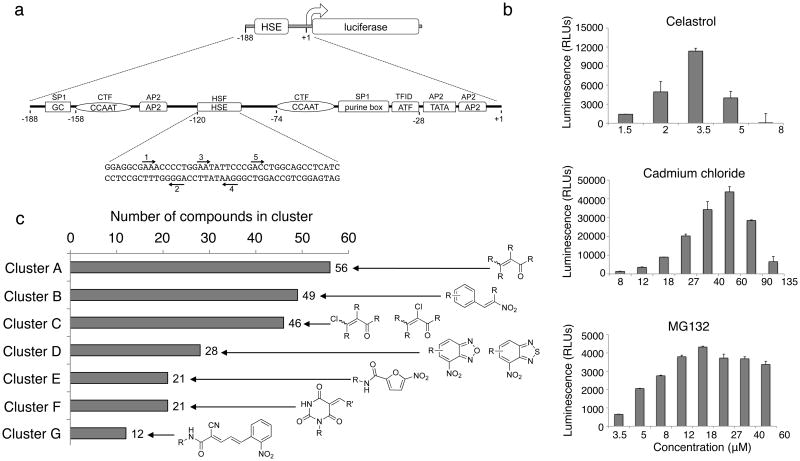
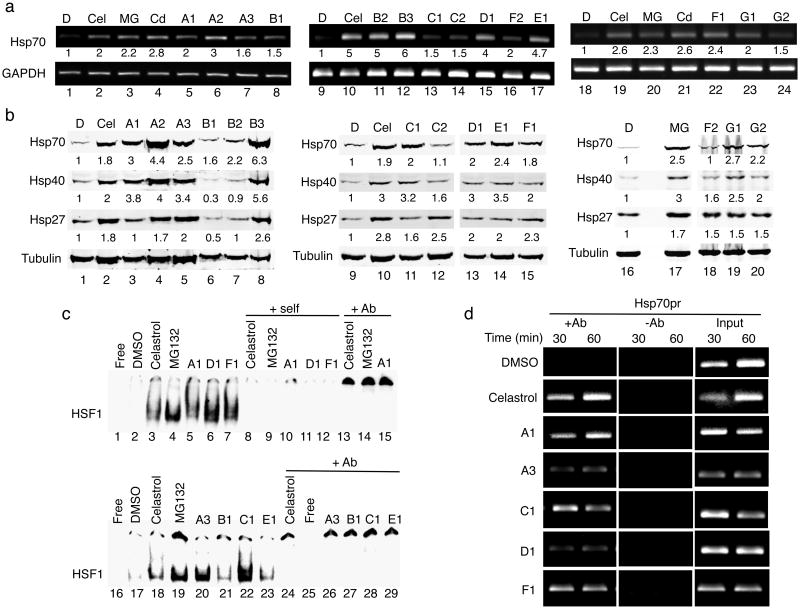
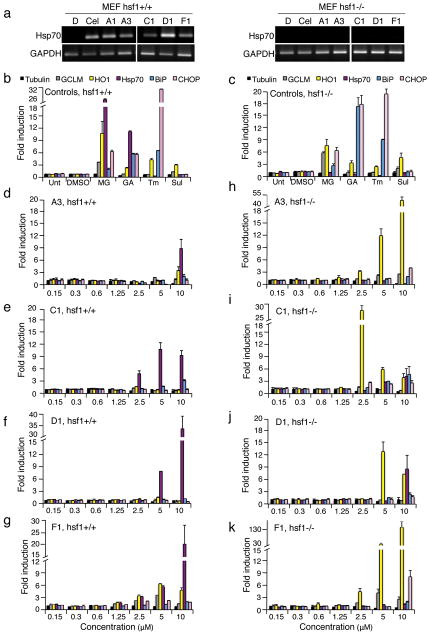
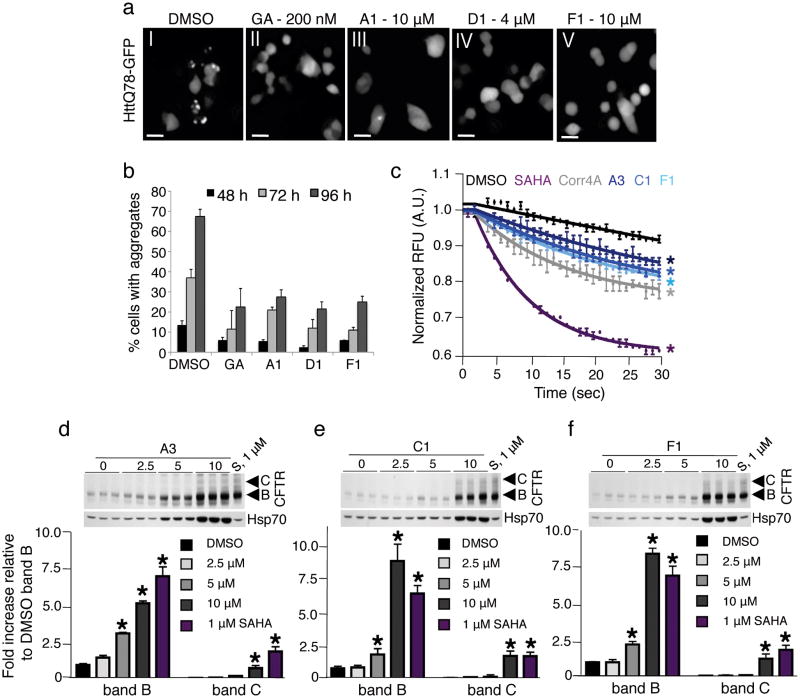
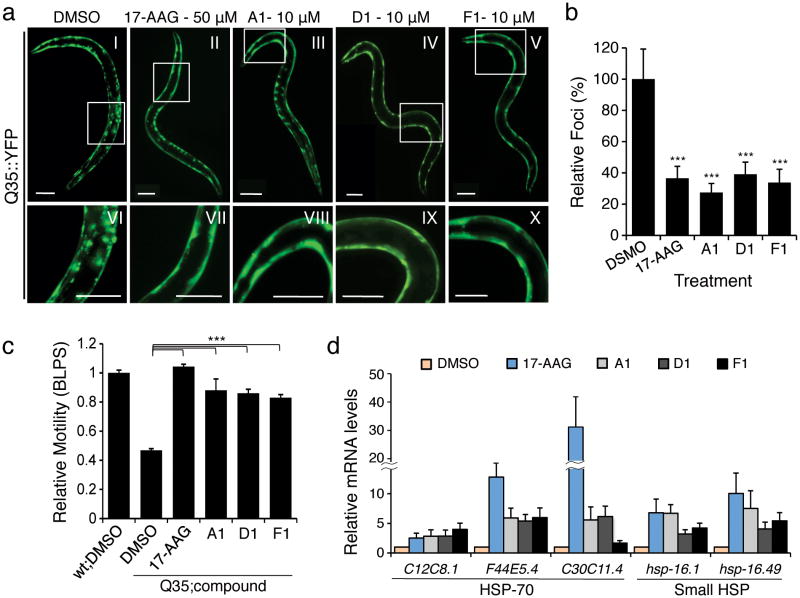
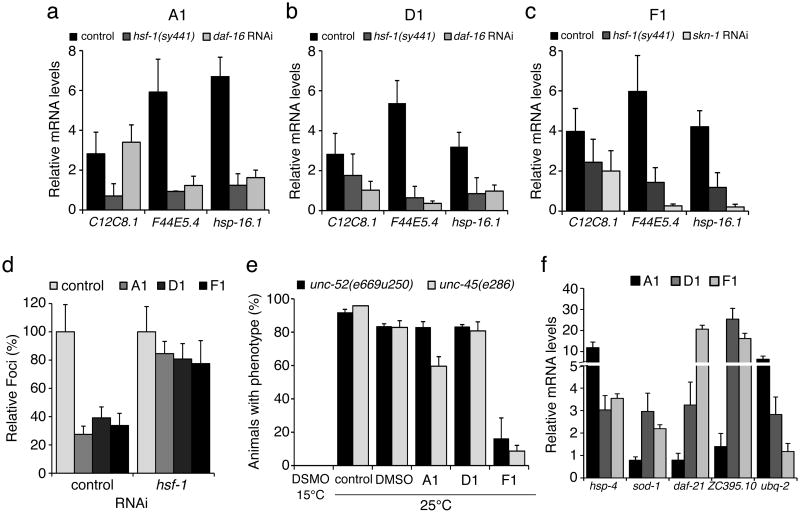
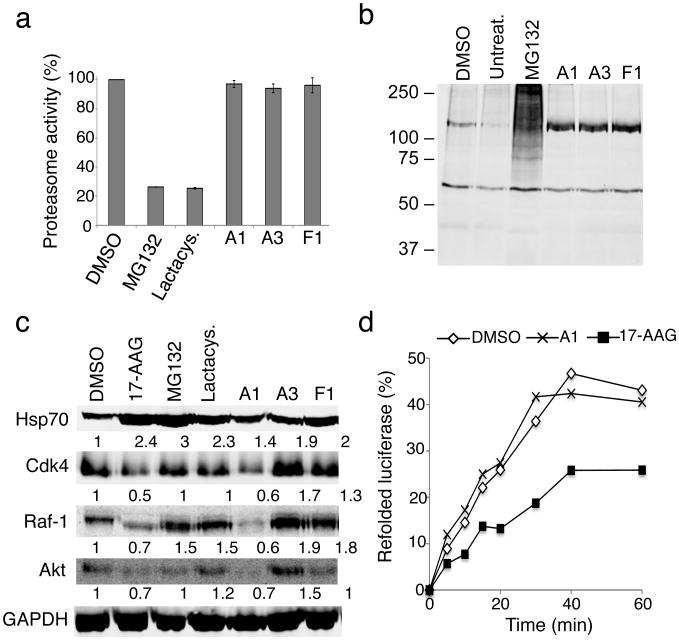
Protein homeostasis (proteostasis) is essential for cellular and organismal health. Stress, aging and the chronic expression of misfolded proteins, however, challenge the proteostasis machinery and the vitality of the cell. Enhanced expression of molecular chaperones, regulated by heat shock transcription factor-1 (HSF-1), has been shown to restore proteostasis in a variety of conformational disease models, suggesting this mechanism as a promising therapeutic approach. We describe the results of a screen comprised of ∼900,000 small molecules that identified new classes of small-molecule proteostasis regulators that induce HSF-1-dependent chaperone expression and restore protein folding in multiple conformational disease models. These beneficial effects to proteome stability are mediated by HSF-1, FOXO, Nrf-2 and the chaperone machinery through mechanisms that are distinct from current known small-molecule activators of the heat shock response. We suggest that modulation of the proteostasis network by proteostasis regulators may be a promising therapeutic approach for the treatment of a variety of protein conformational diseases.


Figures

Figure 1
Figure 1. Identification of small molecule proteostasis regulators (PRs) by high-throughput screening
(a) HeLa-luc cells were used to screen compound libraries to identify small molecule PRs. The Hsp70.1pr-luc construct is diagrammed. The sequences of the upstream region of the human Hsp70.1 promoter from +1 to -188 are represented by a line. The locations of transcription factor binding sites are depicted as boxes and their corresponding genetic elements are indicated in the boxes. The transcription factors that bind to these regions are indicated above the boxes. The nucleotide sequence of the HSE is shown and the inverted nGAAn repeats, to which HSF-1 binds, are labeled with arrows and marked 1 through 5. (b) HeLa-luc cells were treated with celastrol, cadmium chloride and MG132 at the indicated concentrations and luciferase activity was measured after 24 h. Each experiment was performed in triplicate. The standard deviation is shown. (c) Confirmed hits (263) were clustered accordingly to their chemical substructure and a total of 7 clusters were identified. The number of hits per cluster is shown.
Figure 2
Figure 2. The small molecule PRs induce Hsp expression by activating HSF-1
(a) HeLa cells were treated with DMSO, celastrol (Cel, 3 μM), MG132 (MG, 10 μM), CdCl2 (Cd, 50 μM) and selected PRs for 4 h. Similar results were obtained in two independent experiments. Densitometric measurements of Hsp mRNA levels normalized to GAPDH in relation to control DMSO-treated cells were performed using ImageJ software. (b) Western blot analysis of HeLa cells treated with DMSO, celastrol (Cel, 3 μM), MG132 (MG, 10 μM) and selected PRs. Fold induction was calculated as the ratio of normalized Hsp values between a compound-treated sample and the untreated control. Densitometric measurements of Hsp levels normalized to tubulin were performed as in (a). (c) Gel mobility shift assay was performed with a [32P]HSE oligonucleotide and HeLa cell whole cell extracts. DMSO: lanes 2 and 17; celastrol (3 μM): lanes 3 and 18; MG132 (10 μM): lanes 4 and 19; small molecule PRs (10 μM): lanes 5-7 and 20-23. Lanes marked self (lanes 8-12) contained a 200-fold molar excess of unlabeled complementary oligonucleotide. Lanes marked +Ab (lanes 13-15 and 24-29) contained a HSF-1 antibody. (d) HeLa cells were treated with DMSO, celastrol (3 μM) and selected PRs (10 μM) for 30 and 60 min and then chromatin was cross-linked, harvested, and immunoprecipitated with HSF-1 antibody (+Ab). The samples were then analyzed by PCR with primers specific for the Hsp70.1 and the dihydrofolate reductase (DHFR) promoters. The controls include input DNA and a no antibody control (-Ab).
Figure 3
Figure 3. The PRs are HSF-1-dependent
(a) Wild type (hsf-1+/+) and HSF-1 null (hsf-1-/-) mouse embryonic fibroblasts (MEFs) were treated for 4 h with DMSO vehicle, celastrol (3 μM) or indicated PRs (10 μM). RNA was extracted and reverse-transcribed. PCR reactions were performed on cDNA for the indicated transcripts. GAPDH RNA levels were assayed to determine equal loading. (b, d-g) WT and (c, h-k) hsf-1-/- MEFs were treated for 4 h with either DMSO, MG132 (MG, 1 μM), geldanamycin (GA, 1 μM), tunicamycin (Tm, 1 μM), sulphorahane (Sul, 1 μM) or selected PRs (A3, C1, D1 and F1) at the indicated concentrations. Relative levels of multiple cytoprotective genes were measured by real-time PCR (qPCR) with tubulin serving as a reference gene.
Figure 4
Figure 4. The PRs restore proteostasis in cell-based models of cytoplasmic and compartment-specific conformational diseases
(a) PC12 cells expressing httQ74-GFP were treated either with DMSO (panel I), geldanamycin (GA, 200 nM, panel II) or with selected PRs (panels III-V). The representative fluorescence pattern of httQ74-GFP after 72 h of induction is shown. Scale bar: 10 μm. (b) Quantification of results shown in panel (a). Cells containing aggregates were counted and are shown as a percentage of the total number of cells counted. The data shown are derived from three independent experiments. (c) CFBE41o- YFP cells were treated with 0.1% DMSO (black), the positive controls 5 μM SAHA (purple), 10 μM Corrector 4a (Corr4a) (grey) and the PRs A3 (dark blue), C1 (royal blue) and F1 (cyan) at 10 μM for 24 h. Fluorescence quenching is indicative of restored ΔF508-CFTR trafficking (mean ± s.e.m.; n = 3). Color-coded asterisks indicate statistically significant differences from DMSO control at the 30 s time point. (d) CFBE41o- cells were treated with 0.1% DMSO, SAHA (S, 1μM) and selected PRs at the indicated concentrations for 24 h. ΔF508-CFTR trafficking was analyzed by monitoring the band B and C glycoforms (fold increase relative to DMSO band B ± s.e.m.; n = 3) at the various concentrations of PRs. The level of Hsp70 was also monitored by western blot as an indicator of HSF-1 activation. 15 μg of protein were loaded and equal loading was confirmed by staining the membrane with Ponceau S.
Figure 5
Figure 5. The PRs reduce aggregation/toxicity in C. elegans models of diseases associated with polyQ expansions
(a) C. elegans expressing YFP-tagged Q35 protein were treated with either DMSO (panel I) or PRs (panels III-V) at different concentrations (1, 5, 10 and 15 μM) for 4 days. 17-AAG was used as positive control (50 μM, panel II). Fluorescence microscopy images show the PRs that reduced Q35 aggregation at a concentration of 10 μM in 6-day old animals. Panels VI-X show higher magnification images of the boxed areas on the top panels. Scale bar: 0.1 mm. (b) PRs suppress Q35 aggregation as shown by the quantification of fluorescent foci in 6-day old animals, relative to DMSO control. (c) Rescue from polyQ-associated toxicity was determined by comparing the motility of Q35 animals treated with either DMSO alone or the candidate PRs compounds (10 μM) to that of WT animals in DMSO. 17-AAG (50 μM) was used as positive control. Standard error of the mean is shown. (t-test ***p-value<0.001). (d) The PRs up-regulate mRNA expression of cytosolic chaperones (HSP-70 family members and small Hsps) at the concentrations needed to suppress aggregation and toxicity. Real-time qPCR was performed on samples extracted from animals treated with either DMSO, 17-AAG (50 μM), or PRs (10 μM). Standard deviation is shown.
Figure 6
Figure 6. Chaperone expression and reduction in polyQ aggregation in C. elegans is HSF-1-dependent
(a-c) For each of the PRs, chaperone up-regulation is HSF-1 dependent. Wild type (control) and HSF-1 mutant (hsf-1(sy441)) animals were treated with each of the PRs or the positive control 17-AAG, and real-time qPCR was performed to show that both HSP-70 (C12C8.1, F44E5.4) and small Hsps (hsp-16.1) induction does not occur in the hsf-1 mutant background. For compounds A1 and D1, DAF-16 also contributes to chaperone up-regulation, as SKN-1 does for F1. Standard deviation is shown. (d) Suppression of Q35 aggregation by the PRs (shown as % of fluorescent foci) is HSF-1 dependent and is not observed when hsf-1 is down regulated by RNAi. (e) Animals carrying temperature sensitive mutations in muscle proteins UNC-52 (perlecan, stiff paralysis) and UNC-45 (myosin assembly, egg laying defect) were incubated with the PRs. At the restrictive temperature of 25°C, F1 suppressed the muscle dysfunction phenotypes, indicating improved folding of UNC-52 and UNC-45. (f) Stress related genes up-regulated by each of the PRs relative to control (DMSO): hsp-4 (ER HSP-70), sod-1 (oxidative stress), daf-21 and ZC395.10 (HSP-90 and co-chaperone) and ubq-2 (ubiquitin). Standard deviation is shown.
Figure 7
Figure 7. The PRs are not proteasome or Hsp90 inhibitors
(a) HeLa cells were incubated with either DMSO, MG132 (10 μM), lactacystin (lactacys., 6 μM) and the PRs A1, A3 and F1 (10 μM) for 6 h. Proteasome-associated chymotrypsin activity was assessed using the fluorogenic substrate Suc-Leu-Leu-Val-Tyr-7-amido-4-methylcoumarin (suc-LLVY-AMC) as described in Materials and Methods. (b) HeLa cells were either left untreated or treated with DMSO, the proteasome inhibitor MG132 (10 μM), or the PRs A1, A3 and F1 (10 μM) for 16 h. Whole cell extracts of HeLa cells were separated by SDS-PAGE, transferred to membranes, stained with Ponceau S to visualize total protein and probed using a rabbit polyclonal antibody to detect ubiquitin. (c) HeLa cells were treated with either DMSO, 17-AAG (2 μM), MG132 (10 μM), lactacystin (lactacys., 6 μM) or the PRs A1, A3 and F1 (10 μM) for 24 hr. Protein levels of various Hsp90 client proteins (Cdk-4, Raf-1 and Akt) in equal amounts of whole-cell lysates were assessed by western blot analysis. GAPDH was used as loading control. Densitometric measurements of Hsp90 client protein levels normalized to GAPDH in relation to control DMSO-treated cells were performed using ImageJ software. (d) Refolding of chemically-denatured firefly luciferase was assessed in RRL containing 2 mM ATP in the presence of either DMSO (○), 17-AAG (2 μM, ■) or the PR A1 (10 μM, ×). Luciferase activities are expressed as percent of the native enzyme control. The result shown is representative of three experiments.

References

    1. Balch WE, Morimoto RI, Dillin A, Kelly JW. Adapting proteostasis for disease intervention. Science. 2008;319:916–9. - PubMed
    1. Powers ET, Morimoto RI, Dillin A, Kelly JW, Balch WE. Biological and chemical approaches to diseases of proteostasis deficiency. Annu Rev Biochem. 2009;78:959–91. - PubMed
    1. Morimoto RI. Proteotoxic stress and inducible chaperone networks in neurodegenerative disease and aging. Genes Dev. 2008;22:1427–38. - PMC - PubMed
    1. Ron D, Walter P. Signal integration in the endoplasmic reticulum unfolded protein response. Nat Rev Mol Cell Biol. 2007;8:519–29. - PubMed
    1. Haynes CM, Ron D. The mitochondrial UPR - protecting organelle protein homeostasis. J Cell Sci. 2010;123:3849–55. - PubMed

Publication types