. 2011;4(4):361-72.
doi: 10.1504/IJCBDD.2011.044444. Epub 2011 Dec 24.

Integrated cellular and gene interaction modelling of pattern formation

Affiliations

Integrated cellular and gene interaction modelling of pattern formation

Hien Nguyen et al. Int J Comput Biol Drug Des. 2011.

Abstract

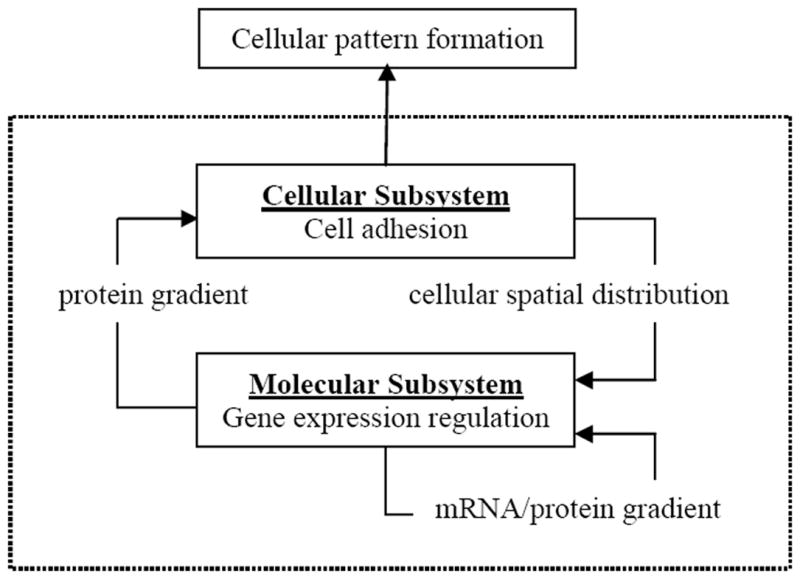
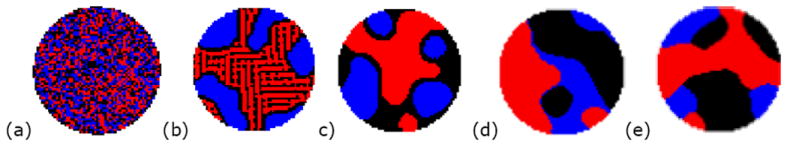
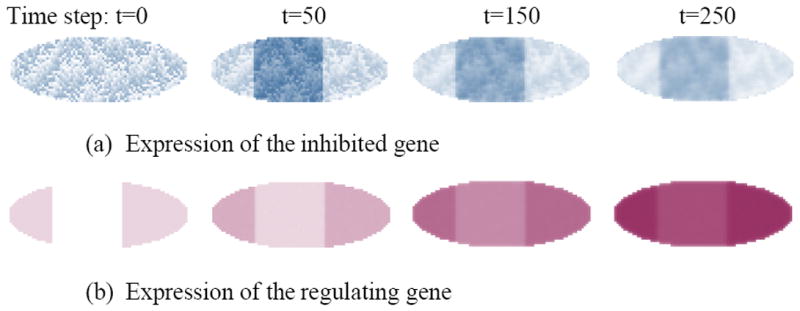
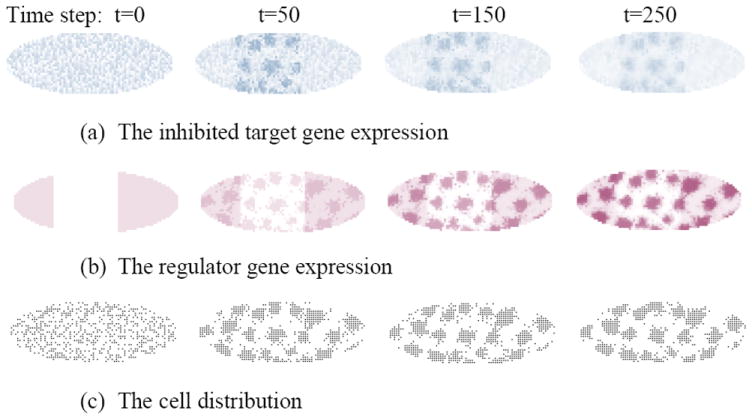
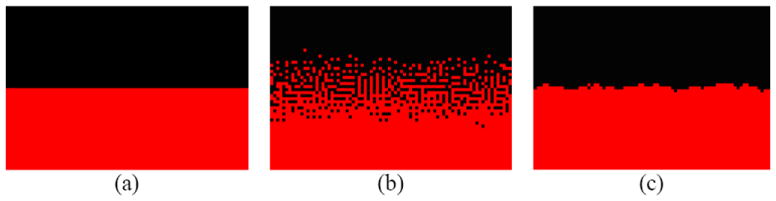
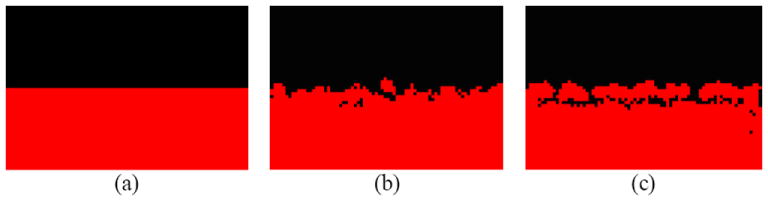
Cellular behaviour depends on and also modifies protein concentration and activity. An integrated cellular and gene interaction model is proposed to reveal this relationship. In this model, protein activity varies spatiotemporally with cellular location, gene interaction, and diffusion. In the meanwhile, cellular behaviour can vary spatially, driven by cell-cell signalling and inhomogeneous protein distribution across cells. This model integrates two components. The first component adopts a variation of the reaction-diffusion mechanism at the gene expression level. The second component is a lattice cellular model based on the Differential Adhesion Hypothesis (DAH) for cell sorting at the cellular level. Cell sorting and tumour invasion were simulated to illustrate the model. This model approximates cellular pattern formation more closely than existing models based on cell density.


Figures

Figure 1
Figure 1
The system diagram of the integrated cellular and molecular model. The model includes the cellular and molecular subsystems. The two subsystems communicate via protein gradients and cellular spatial distribution. Within the cellular subsystem, cell movement is driven by adhesion. Within the molecular subsystem, gene regulation maintains protein dynamics.
Figure 2
Figure 2
Cellular pattern formation based on differential adhesion hypothesis. Black and red dots represent two types of cell. Blue dots represent the medium. (a) Initial random distribution (b) Intermixing (c) Layer (d) Separate and (e) Partial closure.
Figure 3
Figure 3
Mimicking stripe pattern development in the fruit fly embryo due to inhibitory gene interactions without cellular information. The following parameters are used in generating the patterns: σ=1, d1= 0.005, d2=0.003, d3=0.001, χ = 0.005, hi = 0, m = -20 (inhibition coefficient). (a) Expression pattern of the inhibited target gene is represented by light blue – the more concentrated the darker. (b) Temporal expression of the regulator gene over time in the embryo is shown in maroon.
Figure 4
Figure 4
Pattern formation due to both inhibitory gene interaction at the expression level and cell sorting at the cellular level. The following parameters were used in generating the patterns: σ=1, d1=0.005, d2=0.003, d3=0.001, χ=0.005, hi=0, m=-20 (inhibition coefficient).
Figure 5
Figure 5
Cellular patterns under fixed-adhesion conditions solely due to DAH between tumor cells and ECM cells. Black dots represent tumor cells. Red ones represent extracellular matrix. (a) Initial configuration, (b) Intermixing patterns, after 250 time steps, and (c) Layer patterns, after 250 time steps.
Figure 6
Figure 6
Cellular patterns of tumor invasion. Black dots represent tumor cells. Red ones represent extracellular matrix. (a) Initial configuration (b) Finger-like extensions (in white circles) after 200 time steps, and (c) Invasive front (in white oval) after 450 time steps.

Similar articles

References

    1. Agarwal P. Ph D dissertation. Dept of Computer Science, New York University; 1993. Cell-based computer models in developmental biology.
    1. Alexandrova AY. Evolution of cell interactions with extracellular matrix during carcinogenesis. Biochemistry (Moscow) 2008;73(No. 7):733–741. - PubMed
    1. Anderson ARA, Chaplain MAJ, Newman EL, Steele RJC, Thompson AM. Mathematical modeling of tumor invasion and metastasis. Journal of Theoretical Medicine. 2000;2:129–151.
    1. Armstrong NJ, Painter KJ, Sherratt JA. A continuum approach to modeling cell-cell adhesion. J Theor Biol. 2006;243(1):98–113. - PMC - PubMed
    1. Bogenrieder T, Herlyn M. Axis of evil: molecular mechanisms of cancer metastasis. Oncogene. 2003;22:6524–6536. - PubMed

LinkOut - more resources