

An integrated in vitro and in situ study of kinetics of myosin II from frog skeletal muscle
- PMID: 22199170
- PMCID: PMC3381827
- DOI: 10.1113/jphysiol.2011.222984
An integrated in vitro and in situ study of kinetics of myosin II from frog skeletal muscle
Abstract
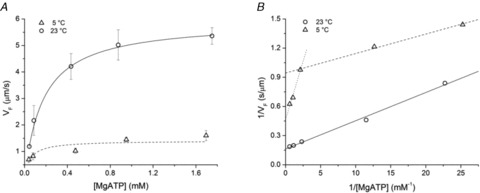
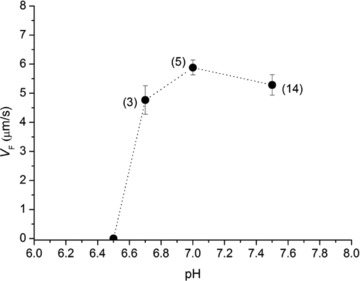
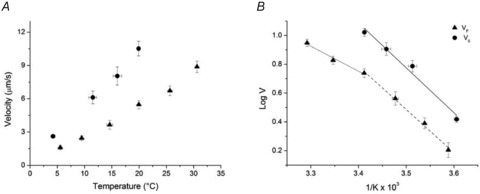
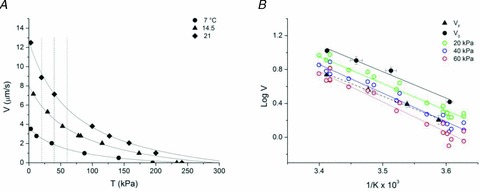
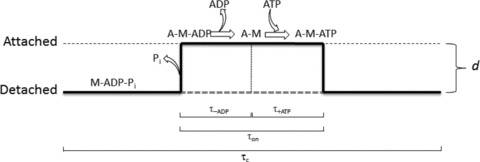
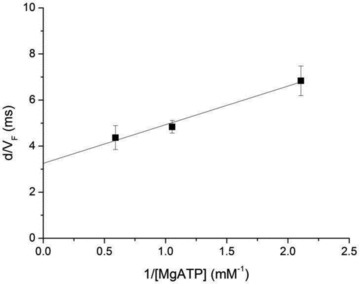
A new efficient protocol for extraction and conservation of myosin II from frog skeletal muscle made it possible to preserve the myosin functionality for a week and apply single molecule techniques to the molecular motor that has been best characterized for its mechanical, structural and energetic parameters in situ.With the in vitro motility assay, we estimated the sliding velocity of actin on frog myosin II (VF) and its modulation by pH, myosin density, temperature (range 4-30◦C) and substrate concentration. VF was 8.88 ± 0.26 μms⁻¹ at 30.6◦C and decreased to 1.60 ± 0.09 μms⁻¹ at 4.5◦C. The in vitro mechanical and kinetic parameters were integrated with the in situ parameters of frog muscle myosin working in arrays in each half-sarcomere. By comparing VF with the shortening velocities determined in intact frog muscle fibres under different loads and their dependence on temperature, we found that VF is 40-50% less than the fibre unloaded shortening velocity (V0) at the same temperature and we determined the load that explains the reduced value of VF. With this integrated approach we could define fundamental kinetic steps of the acto-myosin ATPase cycle in situ and their relation with mechanical steps. In particular we found that at 5◦C the rate of ADP release calculated using the step size estimated from in situ experiments accounts for the rate of detachment of motors during steady shortening under low loads.
Figures
Similar articles
-
Muscle myosin performance measured with a synthetic nanomachine reveals a class-specific Ca2+ -sensitivity of the frog myosin II isoform.J Physiol. 2021 Mar;599(6):1815-1831. doi: 10.1113/JP280976. Epub 2021 Feb 10. J Physiol. 2021. PMID: 33507554
-
Minimum number of myosin motors accounting for shortening velocity under zero load in skeletal muscle.J Physiol. 2017 Feb 15;595(4):1127-1142. doi: 10.1113/JP273299. Epub 2016 Dec 12. J Physiol. 2017. PMID: 27763660 Free PMC article.
-
What limits the velocity of fast-skeletal muscle contraction in mammals?J Mol Biol. 2006 Jan 20;355(3):432-42. doi: 10.1016/j.jmb.2005.10.063. Epub 2005 Nov 9. J Mol Biol. 2006. PMID: 16325202
-
Crossbridge and filament compliance in muscle: implications for tension generation and lever arm swing.J Muscle Res Cell Motil. 2010 Dec;31(4):245-65. doi: 10.1007/s10974-010-9232-7. Epub 2010 Dec 4. J Muscle Res Cell Motil. 2010. PMID: 21132353 Review.
-
Regulation of contraction in striated muscle.Physiol Rev. 2000 Apr;80(2):853-924. doi: 10.1152/physrev.2000.80.2.853. Physiol Rev. 2000. PMID: 10747208 Review.
Cited by
-
Molecular Events of the Crossbridge Cycle Reflected in the Force-Velocity Relationship of Activated Muscle.Front Physiol. 2022 Mar 10;13:846284. doi: 10.3389/fphys.2022.846284. eCollection 2022. Front Physiol. 2022. PMID: 35360243 Free PMC article. Review.
-
Combining single-molecule manipulation and imaging for the study of protein-DNA interactions.J Vis Exp. 2014 Aug 27;(90):51446. doi: 10.3791/51446. J Vis Exp. 2014. PMID: 25226304 Free PMC article.
-
Extraction Protocols for Individual Zebrafish's Ventricle Myosin and Skeletal Muscle Actin for In vitro Motility Assays.Front Physiol. 2017 May 31;8:367. doi: 10.3389/fphys.2017.00367. eCollection 2017. Front Physiol. 2017. PMID: 28620318 Free PMC article.
-
Velocities of unloaded muscle filaments are not limited by drag forces imposed by myosin cross-bridges.Proc Natl Acad Sci U S A. 2015 Sep 8;112(36):11235-40. doi: 10.1073/pnas.1510241112. Epub 2015 Aug 20. Proc Natl Acad Sci U S A. 2015. PMID: 26294254 Free PMC article.
-
Poorly understood aspects of striated muscle contraction.Biomed Res Int. 2015;2015:245154. doi: 10.1155/2015/245154. Epub 2015 Apr 16. Biomed Res Int. 2015. PMID: 25961006 Free PMC article. Review.
References
-
- Bradford MM. A rapid and sensitive method for the quantitation of microgram quantities of protein utilizing the principle of protein-dye binding. Anal Biochem. 1976;72:248–254. - PubMed
-
- Canepari M, Rossi R, Pellegrino MA, Reggiani C, Bottinelli R. Speeds of actin translocation in vitro by myosins extracted from single rat muscle fibres of different types. Exp Physiol. 1999;84:803–806. - PubMed
Publication types
MeSH terms
Substances
LinkOut - more resources
Full Text Sources