. 2012 Feb 17;287(8):5518-27.
doi: 10.1074/jbc.M111.312280. Epub 2011 Dec 23.

Primary role for endoplasmic reticulum-bound ribosomes in cellular translation identified by ribosome profiling

Affiliations

Primary role for endoplasmic reticulum-bound ribosomes in cellular translation identified by ribosome profiling

David W Reid et al. J Biol Chem. .

Abstract

In eukaryotic cells, the spatial regulation of protein expression is frequently conferred through the coupling of mRNA localization and the local control of translation. mRNA localization to the endoplasmic reticulum (ER) is a prominent example of such regulation and serves a ubiquitous role in segregating the synthesis of secretory and integral membrane proteins to the ER. Recent genomic and biochemical studies have now expanded this view to suggest a more substantial role for the ER cellular protein synthesis. We have utilized cell fractionation and ribosome profiling to obtain a genomic survey of the subcellular organization of mRNA translation and report that ribosomal loading of mRNAs, a proxy for mRNA translation, is biased to the ER. Notably, ER-associated mRNAs encoding both cytosolic and topogenic signal-encoding proteins display similar ribosome loading densities, suggesting that ER-associated ribosomes serve a global role in mRNA translation. We propose that the partitioning of mRNAs and their translation between the cytosol and ER compartments may represent a novel mechanism for the post-transcriptional regulation of gene expression.


Figures

FIGURE 1.
FIGURE 1.
Biochemical characterization of translation in cytosol and ER. A and B, subcellular fractions representing the cytosol (A) and ER (B) were analyzed by sucrose gradient velocity sedimentation. The peaks corresponding to the 40 S, 60 S, and 80 S ribosomes are indicated, as are the relative quantities of combined 80 S ribosomes and polyribosomes. C, the subcellular distribution of ribosome-associated mRNA was determined by native oligo(dT) affinity purification of [3H]uridine-labeled polyribosomes and quantification of EDTA-releasable ribosomal subunits. Subcellular mRNA distributions were determined by treating total RNA fractions with RiboMinus, to remove rRNAs, and spectrophotometric quantification of mRNA levels. Values were normalized to a maximum value of 1. Error bars represent ± one S.D.
FIGURE 2.
FIGURE 2.
Analysis of compartmental mRNA translational status. A–D, polyribosome profiles from the cytosol and ER in cycloheximide- (A and B) and puromycin- (C and D) treated cells are illustrated. The downward-facing arrows indicate the migration position of 80 S ribosomes. mRNA translational status was determined by [35S]Cys/Met incorporation and is depicted in the line graphs. Total RNA was isolated from gradient fractions, and the relative levels of the indicated mRNAs were determined by semiquantitative PCR.
FIGURE 3.
FIGURE 3.
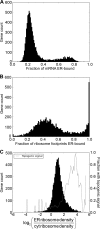
Subcellular distribution of mRNAs and translation. A, histogram distribution of the relative enrichments of mRNAs on the ER. B, histogram distribution of the fraction of translation of each mRNA occurring on the ER. C, histogram distribution of the relative ribosome loading density for each mRNA in the cytosol (cyt) and ER compartments. Also plotted in C is a moving average of the fraction of transcripts that encode a transmembrane domain or signal sequence, as predicted by TMHMM or SignalP.
FIGURE 4.
FIGURE 4.
Cumulative density plot of subcellular mRNA abundance and translation. A–C, cumulative density plots in the cytosol and ER for the abundance of each mRNA in the cytosol and ER (A), ribosomal footprints mapping to each transcript (B), and the density of ribosomes per mRNA for each gene (C).
FIGURE 5.
FIGURE 5.
Subcellular mRNA partitioning and ribosome loading patterns of different mRNA cohorts. A–D, histogram distributions of the fraction of ER-associated mRNAs for cytosolic protein-encoding (A) and topogenic signal-encoding mRNAs (B) and the fraction of ribosome loading on the ER for cytosolic protein-encoding (C) and topogenic signal-encoding (D) mRNAs.
FIGURE 6.
FIGURE 6.
Divergent patterns of subcellular ribosome loading for different mRNA cohorts. A and B, the abundance of each mRNA plotted against its loading with ribosomes in the cytosol (A) and ER (B). C, the density of ribosomal reads per mRNA in the cytosol plotted against that in the ER. D, the fraction of associated ribosomes for each mRNA on the ER plotted against the fraction of that mRNA present on the ER. In each plot, mRNAs encoding proteins targeted to the cytosol and ER are colored separately. Ellipses represent a 50th percentile density, and points represent individual mRNAs.
FIGURE 7.
FIGURE 7.
Spatial patterns of ribosome occupancy on mRNAs. A and B, density of ribosomes near the start and stop codon for cytosolic (A) and ER (B) compartments.
FIGURE 8.
FIGURE 8.
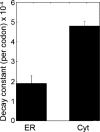
Ribosome processivity differs between cytosolic (Cyt) and ER-bound ribosomes. Ribosome processivity was calculated by fitting an exponential decay curve to the ribosome density in each compartment. Error bars represent at 95% confidence interval.

References

    1. Siekevitz P., Palade G. E. (1958) A cytochemical study on the pancreas of the guinea pig. I. Isolation and enzymatic activities of cell fractions. J. Biophys. Biochem. Cytol 4, 203–218 - PMC - PubMed
    1. Redman C. M. (1969) Biosynthesis of serum proteins and ferritin by free and attached ribosomes of rat liver. J. Biol. Chem. 244, 4308–4315 - PubMed
    1. Hicks S. J., Drysdale J. W., Munro H. N. (1969) Preferential synthesis of ferritin and albumin by different populations of liver polysomes. Science 164, 584–585 - PubMed
    1. Caro L. G., Palade G. E. (1964) Protein synthesis, storage, and discharge in the pancreatic exocrine cell: an autoradiographic study. J. Cell Biol. 20, 473–495 - PMC - PubMed
    1. Jamieson J. D., Palade G. E. (1967) Intracellular transport of secretory proteins in the pancreatic exocrine cell. I. Role of the peripheral elements of the Golgi complex. J. Cell Biol. 34, 577–596 - PMC - PubMed

Publication types