. 2012 Feb 15;28(4):464-9.
doi: 10.1093/bioinformatics/btr703. Epub 2011 Dec 22.

Artemis: an integrated platform for visualization and analysis of high-throughput sequence-based experimental data

Affiliations

Artemis: an integrated platform for visualization and analysis of high-throughput sequence-based experimental data

Tim Carver et al. Bioinformatics. .

Abstract

Motivation: High-throughput sequencing (HTS) technologies have made low-cost sequencing of large numbers of samples commonplace. An explosion in the type, not just number, of sequencing experiments has also taken place including genome re-sequencing, population-scale variation detection, whole transcriptome sequencing and genome-wide analysis of protein-bound nucleic acids.

Results: We present Artemis as a tool for integrated visualization and computational analysis of different types of HTS datasets in the context of a reference genome and its corresponding annotation.

Availability: Artemis is freely available (under a GPL licence) for download (for MacOSX, UNIX and Windows) at the Wellcome Trust Sanger Institute websites: http://www.sanger.ac.uk/resources/software/artemis/.


Figures
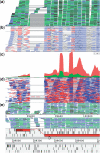
Fig. 1.
Fig. 1.
The read alignment views in Artemis showing RNA-Seq data for Plasmodium falciparum chromosome 1. (a) The ‘stack’ view (paired reads are blue, multiple reads spanning the same region are green, single reads or reads with an unmapped pair are black). Alignment blocks are joined with a grey line to assist in identifying splice sites. (b) The ‘paired-stack’ view (inverted reads are red). (c) The coverage view with a separate plot for each BAM. (d) The ‘inferred size’ view, plotting read pairs along the y-axis by their inferred insert size (or optionally the log of this). (e) The ‘strand stack’ view, with the forward and reverse strand reads above and below the scale, respectively.
Fig. 2.
Fig. 2.
A region of S.pneumoniae antibiotic resistant pandemic clone PMEN1. This shows the variation data for 11 strains. The pspA gene in the reference is a pseudogene as a result of a frame shift. The top VCF panel shows variant and non-variant sites without filtering. The VCF panel below this shows the same region but with filtering applied (i.e. minimum quality score of 60, a minimum read depth of 5). The magenta insertions in most strains show where this frame shift has been caused by a deletion in the reference strain (and one of the other strains). The gene has independently become a pseudogene in a second strain, because of an SNP leading to a premature stop codon (as indicated by the circle in the middle of the line), and a third strain has a recombination that spans this whole region (shown by the increased SNP density).
Fig. 3.
Fig. 3.
The Mycobacterium tuberculosis H37Rv genome showing Illumina re-sequencing data. (a) The red lines on the reads indicate differences to the reference. Below this are an SNP density and coverage plot. (b) A zoomed in view showing the reads (in blue) at the nucleotide level with the SNP bases indicated in red.
Fig. 4.
Fig. 4.
Four Artemis sessions showing data from the Mouse Genomes Project the reference genome is loaded from an indexed FASTA file. (a) Read alignments of two strains are shown in the ‘paired stack’ view with read pairs joined by a grey line. The reads are colour coded by strain with the coverage plot for each underneath. These reveal a deletion in chromosome 19 for 129S1/SvImJ (red) and not in the A/J (green) strain. (b) Displaying reads in chromosome 1 for the A/J strain. Arrows indicate the orientation of the reads. The orange reads have an inferred fragment size of zero. These reads are the mate pairs of the reads that make up the insertion and the direction of the alignment is pointing inwards (i.e. → →← ←) towards the breakpoint of the insertion which coincides with a drop in the coverage. (c) Reads for the A/J, AKR/J, BALB/cJ strains showing a duplication in a region (62155935–62184871) of Chromosome 4 which is shown by the coverage increase. (d) Reads of four strains (129P2/OlaHsd, 129S1/SvImJ, A/J and C3H/HeJ) are plotted along the y-axis by the log of their inferred fragment size and show an inversion in a region in Chromosome 19. Read mates that have the same orientation (e.g. → → or ← ←) are coloured red and are indicative of the ends of the region inverted.
Fig. 5.
Fig. 5.
A region in Chromosome 2 of P. falciparum 3D7. Transcriptome data (in wiggle format) is plotted to show expression levels over time. Data are plotted for seven time intervals: 0, 6, 12, 18, 24, 30, 36 h, from the top of the plot to bottom.

References

    1. Altshuler D., et al. A map of human genome variation from population-scale sequencing. Nature. 2010;467:1061–1073. - PMC - PubMed
    1. Anders S., Huber W. Differential expression analysis for sequence count data. Genome Biol. 2010;11:R106. - PMC - PubMed
    1. Berriman M., et al. The genome of the blood fluke Schistosoma mansoni. Nature. 2009;460:352–358. - PMC - PubMed
    1. Bruno V.M., et al. Comprehensive annotation of the transcriptome of the human fungal pathogen Candida albicans using RNA-seq. Genome Res. 2010;20:1451–1458. - PMC - PubMed
    1. Carver T.J., et al. ACT: the Artemis comparison tool. Bioinformatics. 2005;21:3422–3423. - PubMed

Publication types