. 2011;38(6):627-38.

Central venous pressure and pulmonary capillary wedge pressure: fresh clinical perspectives from a new model of discordant and concordant heart failure

Affiliations

Central venous pressure and pulmonary capillary wedge pressure: fresh clinical perspectives from a new model of discordant and concordant heart failure

Tony S Ma et al. Tex Heart Inst J. 2011.

Abstract

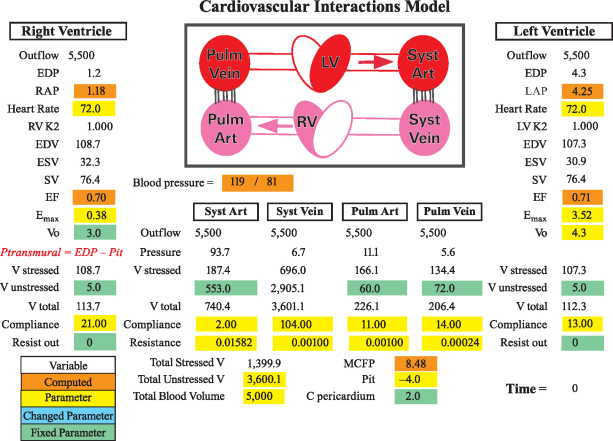
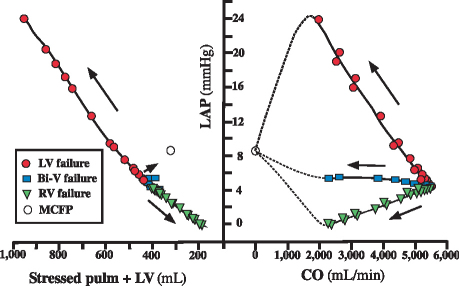
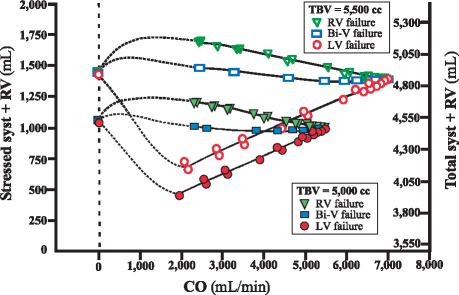
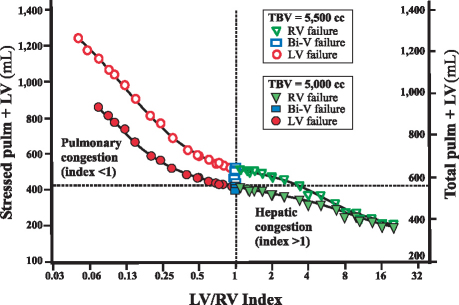
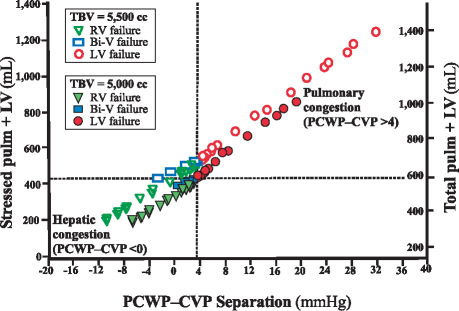
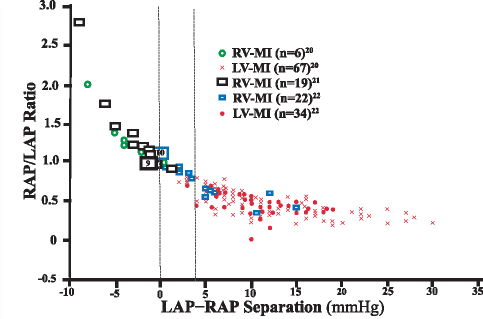
Heart-failure phenotypes include pulmonary and systemic venous congestion. Traditional heart-failure classification systems include the Forrester hemodynamic subsets, which use 2 indices: pulmonary capillary wedge pressure (PCWP) and cardiac index. We hypothesized that changes in PCWP and central venous pressure (CVP), and in the phenotypes of heart failure, might be better evaluated by cardiovascular modeling. Therefore, we developed a lumped-parameter cardiovascular model and analyzed forms of heart failure in which the right and left ventricles failed disproportionately (discordant ventricular failure) versus equally (concordant failure). At least 10 modeling analyses were carried out to the equilibrium state. Acute discordant pump failure was characterized by a "passive" volume movement, with fluid accumulation and pressure elevation in the circuit upstream of the failed pump. In biventricular failure, less volume was mobilized. These findings negate the prevalent teaching that pulmonary congestion in left ventricular failure results primarily from the "backing up" of elevated left ventricular filling pressure. They also reveal a limitation of the Forrester classification: that PCWP and cardiac index are not independent indices of circulation. Herein, we propose a system for classifying heart-failure phenotypes on the basis of discordant or concordant heart failure. A surrogate marker, PCWP-CVP separation, in a simplified situation without complex valvular or pulmonary disease, shows that discordant left and right ventricular failures are characterized by differences of ≥ 4 and ≤ 0 mmHg, respectively. We validated the proposed model and classification system by using published data on patients with acute and chronic heart failure.

Keywords: Blood volume; cardiac output; cardiovascular physiological phenomena; central venous pressure; heart failure/classification/physiopathology; heart ventricles/physiopathology; hemodynamics/physiology; models, cardiovascular; myocardial infarction/physiopathology; pulmonary wedge pressure/physiology; vascular resistance/physiology; ventricular function.


Figures

None
Fig. 1 Schematic representation of the Cardiovascular Interactions model (available from crothe@iupui.edu or http://www.apsarchive.org/resource.cfm?submissionID=997). This model contains 6 elements (2 ventricles, 2 arterial beds, and 2 venous beds) and computes directional flows from the systemic (syst) vein through the right ventricle (RV), pulmonary vein, left ventricle (LV), and systemic artery and vein. The ventricular end-diastolic pressure (EDP) is computed as ventricular volume/compliance, the volume (V) being represented by the latest volume plus inflow minus outflow. The left and right atrial pressures are calculated by subtracting the pressure reduction (flow × resistance) from the upstream pressure. The model-defined parameters are shaded in green and the variable parameters in yellow. Variable parameters that have changed from their initial values are displayed in blue (blue value not shown in the diagram with default parameters only). The computed variables are shaded in orange. Art = artery; C = compliance; EDV = end-diastolic volume; EF = ejection fraction; Emax = maximal elastance; ESV = end-systolic volume; K2 = conductance factor that becomes less than 1.000 at high heart rates (simulates the reduced filling at high heart rates); LAP = left atrial pressure; MCFP = mean circulatory filling pressure; Pit = thoracic pressure; Pstress = stressed pressure; Ptransmural = transmural pressure (EDP – Pit); Pulm = pulmonary; RAP = right atrial pressure; SV = stroke volume; Vo = ESV at a zero-generated pressure
None
Fig. 2 Pulmonary volume and left atrial pressure (LAP) in different modes of heart failure. Right: The relationship between the LAP and the equilibrium cardiac output (CO). The pressure at zero CO is equilibrated to the mean circulatory filling pressure (MCFP). The thoracic pressure is set at −4 mmHg. Simulations with a CO of <2 L/min were not used. Dotted lines show extrapolations. Left: The LAP is plotted as a function of stressed pulmonary (pulm) plus left ventricular (LV) volume in different heart-failure modes. The arrows show the direction of decreasing CO. The LAP and stressed pulm + LV volume increase in LV failure, decrease in right ventricular (RV) failure, and are almost unchanged in biventricular (Bi-V) failure.
None
Fig. 3 Systemic blood volume in left ventricular (LV), right ventricular (RV), and biventricular (Bi-V) heart failure. Symbols at bottom: Relationship between the stressed systemic volume (syst + RV) and the equilibrium cardiac output (CO). The total systemic volume (total syst + RV) is also shown. Dotted lines show extrapolations. Symbols at top: Effect of hypervolemia (total blood volume [TBV] = 5,500 cc), or a 10% increase from baseline. The difference in compliance between the pulmonary and systemic beds causes most of the added volume to be in the systemic bed. Consequently, discordant LV failure in hypervolemia causes a greater amount of volume mobilization into the pulmonary bed.
None
Fig. 4 Pulmonary blood volume in left ventricular (LV), right ventricular (RV), and biventricular (Bi-V) heart failure. Stressed pulmonary + left ventricular (stressed pulm + LV) volume in concordant versus discordant ventricular failure is plotted as a function of the LV and RV contractile function index. The total pulmonary volume (total pulm + LV) is also shown. Discordant LV failure (solid circles; index <1) is associated with a curvilinear increase in the stressed pulm + LV volume (left upper quadrant; stressed pulm + LV volume >410 cc; total pulm + LV volume >540 cc). Discordant RV failure (solid triangles; index >1) is associated with a decrease in stressed pulm + LV volume (right lower quadrant), or an implied increase in systemic/hepatic volume. Concordant biventricular failure (solid rectangles; index=1) is associated with lesser volume movement. Hypervolemia (total blood volume [TBV] = 5,500 cc) is denoted by an equivalent hollow circle, rectangle, or triangle. Hypervolemia changes the resting pulmonary volume but does not change the overall relationship described.
None
Fig. 5 Pulmonary total blood volume (TBV) in left ventricular (LV), right ventricular (RV), and biventricular (Bi-V) heart failure. The stressed pulmonary + left ventricular (stressed pulm + LV) volume in concordant versus discordant ventricular failure is plotted as a function of pulmonary capillary wedge pressure–central venous pressure (PCWP–CVP) separation. Euvolemia and hypervolemia are represented by solid and hollow markers, respectively. The total pulmonary volume (total pulm + LV) is also shown. Discordant LV failure (solid and hollow circles) is indicated by a PCWP–CVP separation of >4 mmHg. Discordant RV failure (solid and hollow triangles) is indicated by a PCWP–CVP separation of <0 mmHg. Concordant Bi-V failure (solid and hollow rectangles) parallels RV failure but to a lesser degree, with a PCWP–CVP separation of 0 to 4 mmHg. Note that hypervolemia does not change the basic relationships that allow heart-failure phenotypes to be differentiated by means of PCWP–CVP separation.
None
Fig. 6 Pulmonary blood volume (PBV) as a function of the weighted left atrial pressure (LAP) index (7.56 LAP + 0.067 total blood volume [TBV]). The data of Lewis and co-authors were adopted from 2 series of 69 patients (1 patient had 2 serial studies; only the 1st determination was used). The insert shows the histogram of the cardiac index (CI) in the population.
None
Fig. 7 The right atrial pressure-to-left atrial pressure (RAP/LAP) ratio is plotted as a function of LAP-to-RAP (LAP–RAP) separation. Data published by 3 different groups were combined for the analysis (total n=148). The hollow blue rectangles show right ventricular myocardial infarction (RV-MI) data and the solid red circles show left ventricular myocardial infarction (LV-MI) data, as reported by Lopez-Sendon and colleagues. The hollow green circles and the red crosses show RV-MI and LV-MI data, respectively, as reported by Cohn and co-authors. The hollow black rectangles show RV-MI data reported by Lloyd and associates. The vertical delimiter of ≤0 mmHg was selected for discordant RV failure as per previous modeling analysis (see Fig. 6). A vertical delimiter of ≥4 mmHg was selected for discordant LV failure (Fig. 6). Large rectangles with numbers within them show the total number of patients in each study with a LAP–RAP of 0 mmHg, depicted slightly offset from the correct position for easier graphical representation of each value.

Similar articles

Cited by

References

    1. Wood PH. Diseases of the heart and circulation. 2nd ed. Philadelphia: JB Lippincott; 1956. p. 264–317.
    1. Burkhoff D, Tyberg JV. Why does pulmonary venous pressure rise after onset of LV dysfunction: a theoretical analysis. Am J Physiol 1993;265(5 Pt 2):H1819–28. - PubMed
    1. Magder S, Veerassamy S, Bates JH. A further analysis of why pulmonary venous pressure rises after the onset of LV dysfunction. J Appl Physiol 2009;106(1):81–90. - PubMed
    1. Gheorghiade M, Follath F, Ponikowski P, Barsuk JH, Blair JE, Cleland JG, et al. Assessing and grading congestion in acute heart failure: a scientific statement from the acute heart failure committee of the heart failure association of the European Society of Cardiology and endorsed by the European Society of Intensive Care Medicine. Eur J Heart Fail 2010;12(5): 423–33. - PubMed
    1. Cournand A, Riley RL, Breed ES, Baldwin ED, Richards DW, Lester MS, Jones M. Measurement of cardiac output in man using the technique of catheterization of the right auricle or ventricle. J Clin Invest 1945;24(1):106–16. - PMC - PubMed