

Image microarrays (IMA): Digital pathology's missing tool
- PMID: 22200030
- PMCID: PMC3237063
- DOI: 10.4103/2153-3539.86829
Image microarrays (IMA): Digital pathology's missing tool
Abstract
Introduction: The increasing availability of whole slide imaging (WSI) data sets (digital slides) from glass slides offers new opportunities for the development of computer-aided diagnostic (CAD) algorithms. With the all-digital pathology workflow that these data sets will enable in the near future, literally millions of digital slides will be generated and stored. Consequently, the field in general and pathologists, specifically, will need tools to help extract actionable information from this new and vast collective repository.
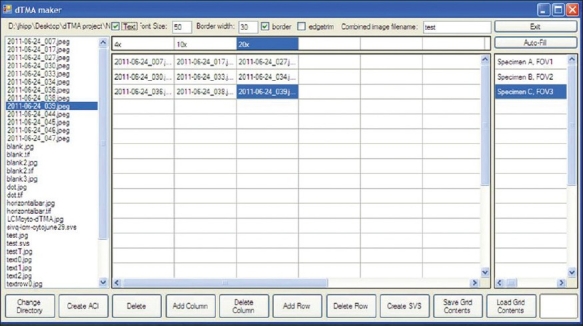
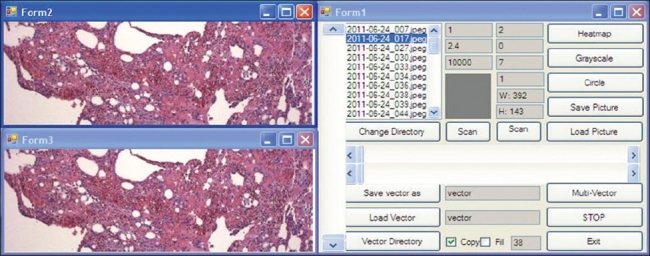
Methods: To address this limitation, we designed and implemented a tool (dCORE) to enable the systematic capture of image tiles with constrained size and resolution that contain desired histopathologic features.
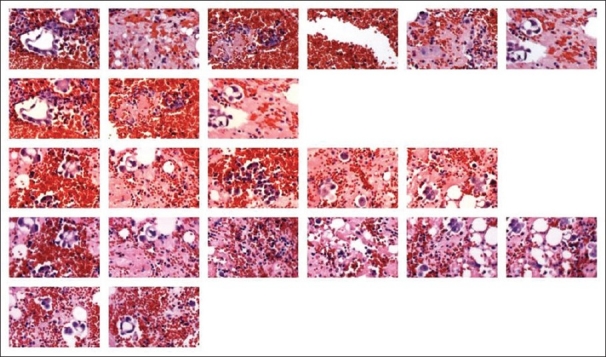
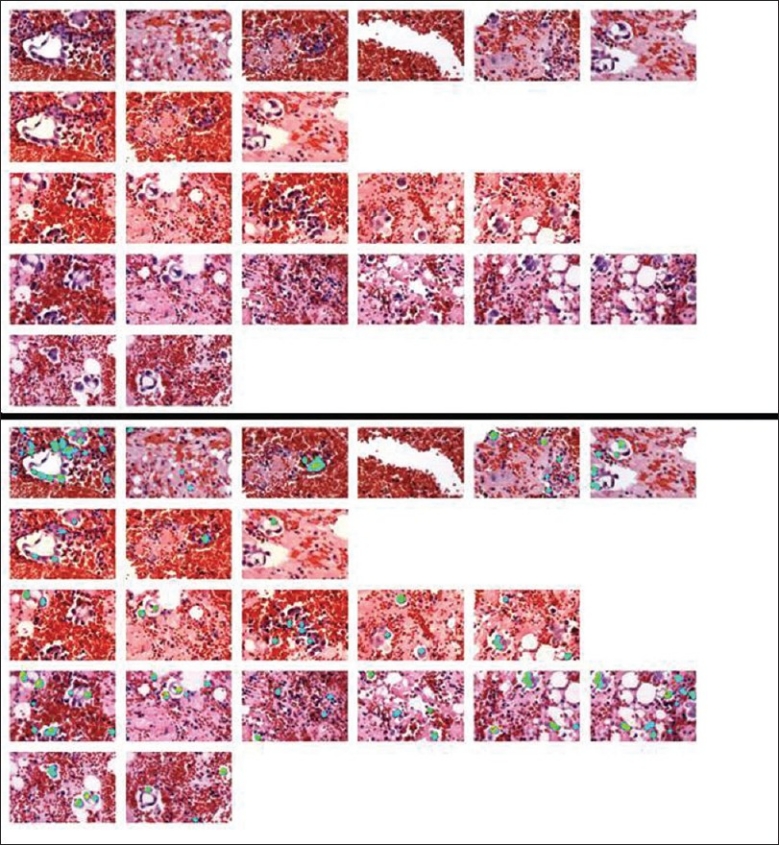
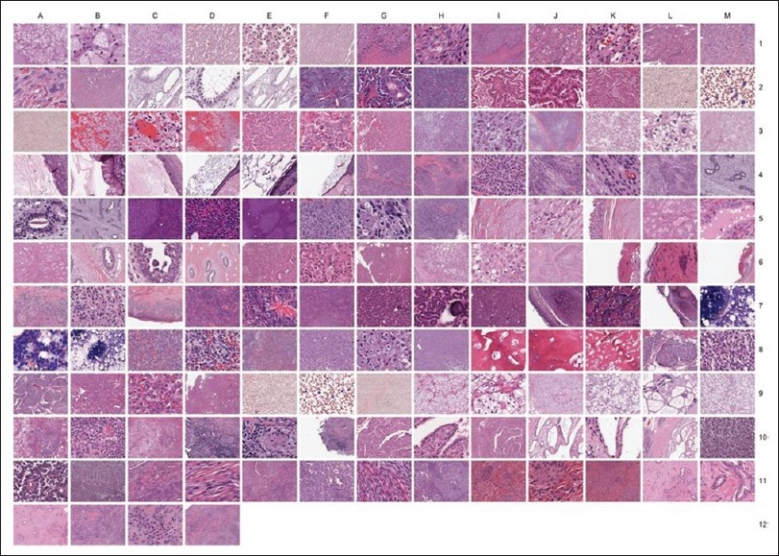
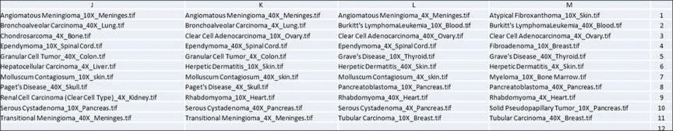
Results: In this communication, we describe a user-friendly tool that will enable pathologists to mine digital slides archives to create image microarrays (IMAs). IMAs are to digital slides as tissue microarrays (TMAs) are to cell blocks. Thus, a single digital slide could be transformed into an array of hundreds to thousands of high quality digital images, with each containing key diagnostic morphologies and appropriate controls. Current manual digital image cut-and-paste methods that allow for the creation of a grid of images (such as an IMA) of matching resolutions are tedious.
Conclusion: The ability to create IMAs representing hundreds to thousands of vetted morphologic features has numerous applications in education, proficiency testing, consensus case review, and research. Lastly, in a manner analogous to the way conventional TMA technology has significantly accelerated in situ studies of tissue specimens use of IMAs has similar potential to significantly accelerate CAD algorithm development.
Keywords: IMA; SIVQ; TMA; WSI.
Figures
Similar articles
-
Image microarrays derived from tissue microarrays (IMA-TMA): New resource for computer-aided diagnostic algorithm development.J Pathol Inform. 2012;3:24. doi: 10.4103/2153-3539.98168. Epub 2012 Jul 12. J Pathol Inform. 2012. PMID: 22934237 Free PMC article.
-
A data model and database for high-resolution pathology analytical image informatics.J Pathol Inform. 2011;2:32. doi: 10.4103/2153-3539.83192. Epub 2011 Jul 26. J Pathol Inform. 2011. PMID: 21845230 Free PMC article.
-
Creation of a digital slide and tissue microarray resource from a multi-institutional predictive toxicology study in the rat: an initial report from the PredTox group.Exp Toxicol Pathol. 2008 Aug;60(4-5):235-45. doi: 10.1016/j.etp.2007.12.004. Epub 2008 May 13. Exp Toxicol Pathol. 2008. PMID: 18479893
-
Applications and challenges of digital pathology and whole slide imaging.Biotech Histochem. 2015 Jul;90(5):341-7. doi: 10.3109/10520295.2015.1044566. Epub 2015 May 15. Biotech Histochem. 2015. PMID: 25978139 Review.
-
Utility of whole slide imaging and virtual microscopy in prostate pathology.APMIS. 2012 Apr;120(4):298-304. doi: 10.1111/j.1600-0463.2011.02872.x. APMIS. 2012. PMID: 22429212 Review.
Cited by
-
A methodology for comprehensive breast cancer Ki67 labeling index with intra-tumor heterogeneity appraisal based on hexagonal tiling of digital image analysis data.Virchows Arch. 2015;467:711-722. doi: 10.1007/s00428-015-1865-x. Epub 2015 Oct 19. Virchows Arch. 2015. PMID: 26481244
-
SIVQ-LCM protocol for the ArcturusXT instrument.J Vis Exp. 2014 Jul 23;(89):51662. doi: 10.3791/51662. J Vis Exp. 2014. PMID: 25078867 Free PMC article.
-
Image microarrays derived from tissue microarrays (IMA-TMA): New resource for computer-aided diagnostic algorithm development.J Pathol Inform. 2012;3:24. doi: 10.4103/2153-3539.98168. Epub 2012 Jul 12. J Pathol Inform. 2012. PMID: 22934237 Free PMC article.
-
Pathology Imaging Informatics for Clinical Practice and Investigative and Translational Research.N Am J Med Sci (Boston). 2012 Apr;5(2):103-109. doi: 10.7156/v5i2p103. N Am J Med Sci (Boston). 2012. PMID: 22855694 Free PMC article.
References
-
- Avninder S, Ylaya K, Hewitt SM. Tissue microarray: A simple technology that has revolutionized research in pathology. J Postgrad Med. 2008;54:158–62. - PubMed
-
- Nocito A, Kononen J, Kallioniemi OP, Sauter G. Tissue microarrays (TMAs) for high-throughput molecular pathology research. Int J Cancer. 2001;94:1–5. - PubMed
-
- Battifora H. The multitumor (sausage) tissue block: Novel method for immunohistochemical antibody testing. Lab Invest. 1986;55:244–8. - PubMed
-
- Singh A, Sau AK. Tissue Microarray: A powerfuland rapidly evolving tool for high-throughput analysis of clinical specimens. IJCRI. 2010;1:1–6.
-
- Kononen J, Bubendorf L, Kallioniemi A, Barlund M, Schraml P, Leighton S, et al. Tissue microarrays for high-throughput molecular profiling of tumor specimens. Nat Med. 1998;4:844–7. - PubMed
LinkOut - more resources
Full Text Sources
Miscellaneous
