. 2012 Jan;139(1):31-56.
doi: 10.1085/jgp.201110654.

Speed, adaptation, and stability of the response to light in cone photoreceptors: the functional role of Ca-dependent modulation of ligand sensitivity in cGMP-gated ion channels

Affiliations

Speed, adaptation, and stability of the response to light in cone photoreceptors: the functional role of Ca-dependent modulation of ligand sensitivity in cGMP-gated ion channels

Juan I Korenbrot. J Gen Physiol. 2012 Jan.

Abstract

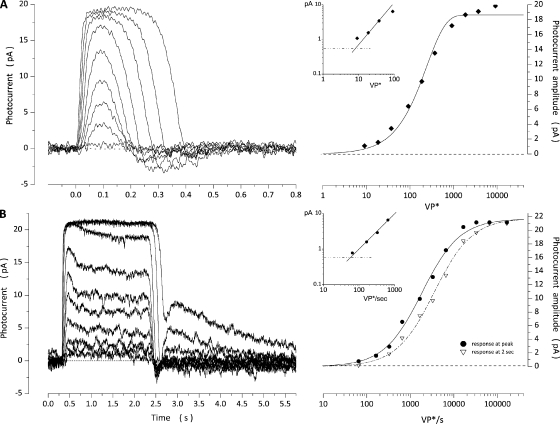
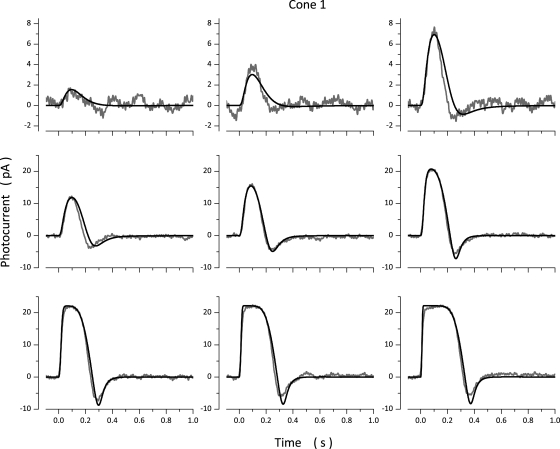
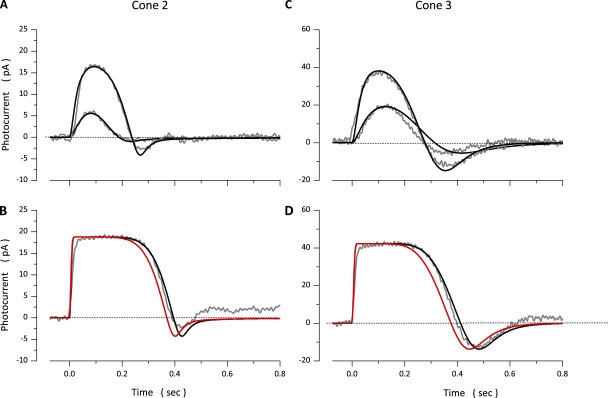
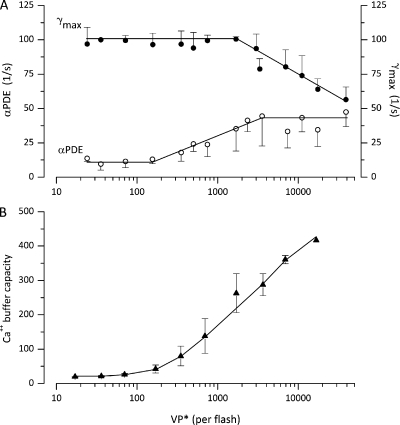
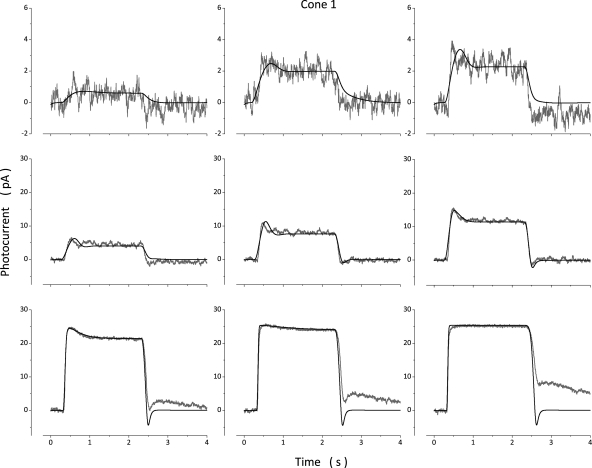
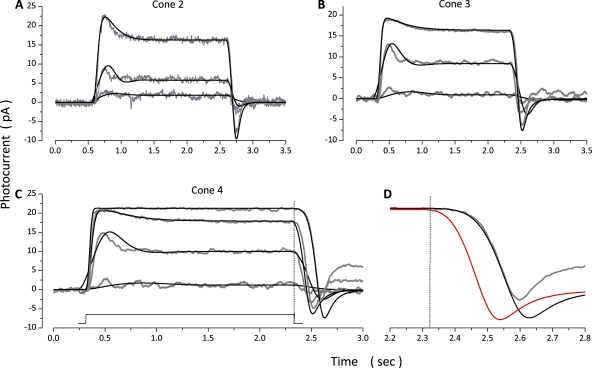
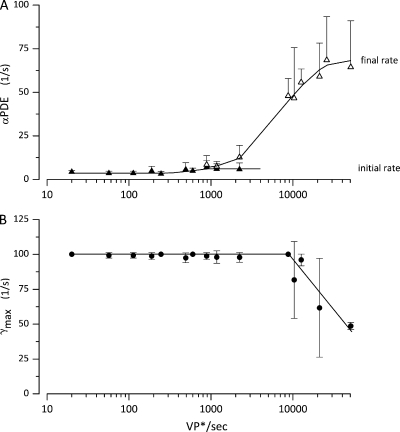
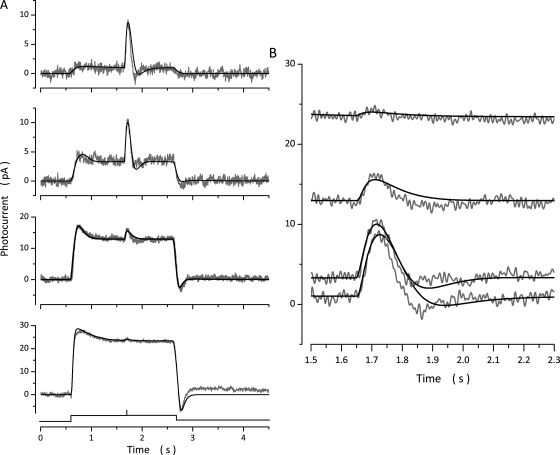
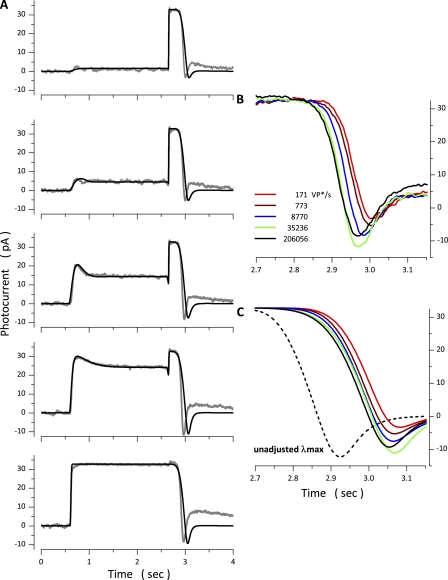
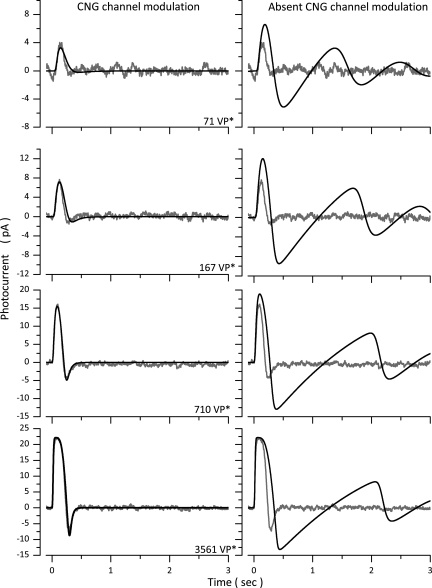
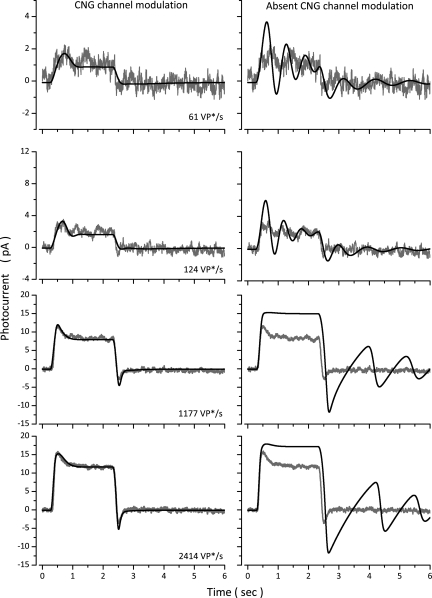
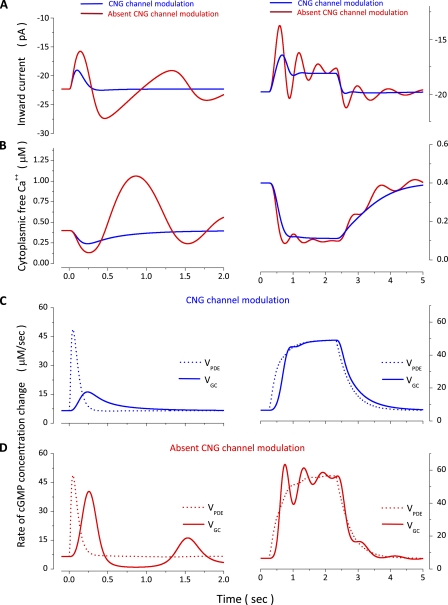
The response of cone photoreceptors to light is stable and reproducible because of the exceptional regulation of the cascade of enzymatic reactions that link visual pigment (VP) excitation to the gating of cyclic GMP (cGMP)-gated ion channels (cyclic nucleotide-gated [CNG]) in the outer segment plasma membrane. Regulation is achieved in part through negative feedback control of some of these reactions by cytoplasmic free Ca(2+). As part of the control process, Ca(2+) regulates the phosphorylation of excited VP, the activity of guanylate cyclase, and the ligand sensitivity of the CNG ion channels. We measured photocurrents elicited by stimuli in the form of flashes, steps, and flashes superimposed on steps in voltage-clamped single bass cones isolated from striped bass retina. We also developed a computational model that comprises all the known molecular events of cone phototransduction, including all Ca-dependent controls. Constrained by available experimental data in bass cones and cone transduction biochemistry, we achieved an excellent match between experimental photocurrents and those simulated by the model. We used the model to explore the physiological role of CNG ion channel modulation. Control of CNG channel activity by both cGMP and Ca(2+) causes the time course of the light-dependent currents to be faster than if only cGMP controlled their activity. Channel modulation also plays a critical role in the regulation of the light sensitivity and light adaptation of the cone photoresponse. In the absence of ion channel modulation, cone photocurrents would be unstable, oscillating during and at the offset of light stimuli.


Figures

Figure 1.
Figure 1.
Photocurrents measured under voltage clamp at −40 mV in a dark-adapted bass single cone in response to 10-msec flashes or 2-s steps of 540-nm light. (A) Responses elicited with flashes of intensities: 9, 18, 37, 91, 178, 372, 913, 1,933, 3,685, and 9,133 VP*. Peak amplitude increases with light intensity (right) in a manner well described by an exponential saturation function (Eq. 1.1; continuous line), with Ipeak = 18.8 pA and k = 260.1 VP*. The inset is a log–log plot to show that signal threshold was ∼8 VP*. (B) Responses elicited with step stimuli of intensities: 65, 327, 651, 1,635, 3,266, 6,513, 16,369, 65,131, and 163,687 VP*/s. The current at its peak (•) is more sensitive to light than in the stationary state (▽; right). Amplitude dependence on light intensity is well described by a Michaelis–Menten function (Eq. 1.2; continuous line), with Ipeak = 21.8 pA and σ = 1,844 VP*/s for the response at its peak, and Imax = 21.8 pA and σ = 3,522 VP*/s for the response at 2 s. The inset is a log–log plot of the peak amplitude of the step response to show that signal threshold was 56 VP*/s.
Figure 2.
Figure 2.
Experimental (gray traces, noisy) and simulated (black traces, noiseless) photocurrents measured at −40 mV in a dark-adapted bass single cone. Photocurrents were elicited by 10-msec light flashes of intensity: 36, 71, 167, 356, 710, 1,744, 3,561, 7,106, and 17,443 VP*. The values of the parameters used to compute the simulated data are listed in Table 3 (Cone 1).
Figure 3.
Figure 3.
Experimental (gray traces, noisy) and simulated (black traces, noiseless) photocurrents measured at −40 mV in two different dark-adapted bass single cones. Data in A and B were measured in the same photoreceptor. Flash intensities tested were 174 and 1,747 VP* in A and 17,743 VP* in B. C and D were measured in the same cell. Flash intensities tested were 173 and 808 VP* in C and 7,720 VP* in D. The values of the parameters used to compute the simulated data are listed in Table 3. At intensities above amplitude saturation (B and D), simulations fit experimental data only if the VP* inactivation rate, γmax, was slower than for dim light responses (Table 3). The simulations illustrated in red were obtained when γmax was kept at the same value used to fit the dim light responses.
Figure 4.
Figure 4.
Light dependence of the values of adjustable parameters inferred from successful simulations of flash photocurrents. Data points are the mean ± SD of values computed in 18 single cones. The light intensity shown on the graph is the mean of intensities binned within about plus or minus 10% of the mean. (A) PDE* inactivation rate (αPDE) and VP* phosphorylation rate (λmax). (B) Ca2+-buffering capacity (dCaTotalBdCa; Eq. 2.11). Continuous lines are drawn by eye to join the data points.
Figure 5.
Figure 5.
Experimental (gray traces, noisy) and simulated (black traces, noiseless) photocurrents measured at −40 mV in a dark-adapted bass single cone. Photocurrents were elicited with 2-s light steps of intensity: 21, 61, 120, 246, 601, 1,177, 12,614, 25,873, and 50,681 VP*/s. The values of the parameters used in the simulations shown are listed in Table 4 (Cone 1).
Figure 6.
Figure 6.
Experimental (gray traces, noisy) and simulated (black traces, noiseless) step photocurrents measured at −40 mV in three different dark-adapted bass single cones. (A) Intensities tested were 171, 773, and 8,770 VP*/s. (B) Intensities tested were 50, 963, and 10,320 VP*/s. (C) Intensities tested were 50, 963, 10,320, and 41,466 VP*/s. The values of the parameters used in the simulations shown are listed in Table 4. (D) A time-expanded view of the end of the response to 41,466 VP*/s shown in C. At this intensity, photocurrent amplitude was saturated. The unsuccessful simulations illustrated in red were computed when γmax was kept at the same value used to fit the responses to dim stimuli.
Figure 7.
Figure 7.
Light dependence of the values of adjustable parameters inferred from successful simulations of step photocurrents. Data points are the mean ± SD of values computed in 10 single cones. The light intensity shown on the graph is the mean of intensities binned within plus or minus 10% of the mean. (A) Initial and final values of PDE* inactivation rate (αPDEinit and αPDEinit; Eq. 3.14). (B) VP* phosphorylation rate (γmax). The continuous lines are drawn by eye to join the data points.
Figure 8.
Figure 8.
Experimental (gray traces, noisy) and simulated (black traces, noiseless) photocurrents elicited by the same intensity flash superimposed on light steps of varying intensity. (A) Photocurrents generated by a 150-VP* flash delivered 1 s after the onset of light steps of intensities: 171, 773, 8,770, and 35,236 VP*/s. (B) Time-expanded view of the response to the constant intensity flash. Flash photocurrent on 171 VP*/s background was 7.3 pA in peak amplitude, 80 msec time to peak. On 773 VP*/s background it was 6.5 pA in peak amplitude, 77 msec time to peak. On 8,770 VP*/s background it was 2.9 pA in peak amplitude, 73 msec time to peak. On 35,236 VP*/s background it was 0.9 pA in peak amplitude, 63 msec time to peak.
Figure 9.
Figure 9.
Experimental (gray traces, noisy) and simulated (black traces, noiseless) photocurrents elicited by the same intensity flash superimposed on light steps of varying intensity. (A) Photocurrents generated by the same flash, one that saturated photocurrent amplitude, delivered at the end of 2.5-s light steps of intensities: 171, 773, 8,770, 35,236, and 206,056 VP*/s. (B and C) Time-expanded views of experimental and simulated photocurrents, respectively. Shown are the ends of the saturated flash responses recorded at various step intensities, as labeled. Successful flash simulations were obtained by adjusting the value of γmax from 90 s−1 during the step response to 90 s−1 at 171 VP*/s, 90 s−1 at 773 VP*/s, 52 s−1 at 8,770 VP*/s, 28 s−1 at 33,265 VP*/s, and 30 s−1 at 206,056 VP*/s. The dashed black line in C is the simulated response on a background of 206,056 VP*/s computed without adjusting γmax, keeping its value the same as that used to simulate the step response.
Figure 10.
Figure 10.
The physiological role of Ca-dependent CNG channel modulation in flash photocurrents. Experimental photocurrents were measured at −40 mV in a dark-adapted bass single cone in response to 10-msec flashes of intensities: 71, 167, 710, and 3,561 VP*. The panels on the left illustrate experimental (gray traces, noisy) and simulated (black traces, noiseless) photocurrents computed with the normal complete model (Table 3, Cone 1). The panels on the right reproduce the same experimental data (gray traces, noisy), now superimposed by simulated photocurrents (black traces, noiseless) computed with a model in which CNG channel modulation is omitted.
Figure 11.
Figure 11.
The physiological role of Ca-dependent CNG channel modulation in step photocurrents. Experimental photocurrents were measured in a dark-adapted bass single cone in response to steps of 61, 124, 1,177, and 2,414 VP*. The panels on the left illustrate experimental (gray traces, noisy) and simulated (black traces, noiseless) photocurrents computed with the normal complete model (Table 4, Cone 1). The panels on the right reproduce the same experimental data (gray traces, noisy), now superimposed by simulated photocurrents (black, noiseless traces) computed with a model in which CNG channel modulation is omitted.
Figure 12.
Figure 12.
Simulated dynamics of several molecular events underlying flash and step photoresponses in bass single cones. Left panels show various biochemical and biophysical events elicited by a 10-msec flash of 167 VP* intensity (Table 3, Cone 1). Right panels show the same events elicited by a 2-s step of 124 VP*/s in a different cone (Table 4, Cone 1). (A and B) The inward outer segment membrane current and the cytoplasmic free Ca2+ concentration. Superimposed in each panel are the results of simulations with the complete model (blue traces) and one in which CNG channel modulation is omitted (red traces). (C) Enzymatic activity of PDE (dashed line) and GC (solid line) and their change with light computed with the complete model. (D) Enzymatic activity of PDE (dashed line) and GC (solid line) computed with the model that omits CNG channel modulations.

Similar articles

Cited by

References

    1. Arinobu D., Tachibanaki S., Kawamura S. 2010. Larger inhibition of visual pigment kinase in cones than in rods. J. Neurochem. 115:259–268 10.1111/j.1471-4159.2010.06925.x - DOI - PubMed
    1. Baehr W., Karan S., Maeda T., Luo D.G., Li S., Bronson J.D., Watt C.B., Yau K.W., Frederick J.M., Palczewski K. 2007. The function of guanylate cyclase 1 and guanylate cyclase 2 in rod and cone photoreceptors. J. Biol. Chem. 282:8837–8847 10.1074/jbc.M610369200 - DOI - PMC - PubMed
    1. Bauer P.J. 1996. Cyclic GMP-gated channels of bovine rod photoreceptors: affinity, density and stoichiometry of Ca(2+)-calmodulin binding sites. J. Physiol. 494:675–685 - PMC - PubMed
    1. Baylor D.A. 1987. Photoreceptor signals and vision. Proctor lecture. Invest. Ophthalmol. Vis. Sci. 28:34–49 - PubMed
    1. Berlin J.R., Bassani J.W., Bers D.M. 1994. Intrinsic cytosolic calcium buffering properties of single rat cardiac myocytes. Biophys. J. 67:1775–1787 10.1016/S0006-3495(94)80652-6 - DOI - PMC - PubMed

Publication types