. 2011 Dec 26;195(7):1123-40.
doi: 10.1083/jcb.201108121.

Cdc6 expression represses E-cadherin transcription and activates adjacent replication origins

Affiliations

Cdc6 expression represses E-cadherin transcription and activates adjacent replication origins

Maria Sideridou et al. J Cell Biol. .

Abstract

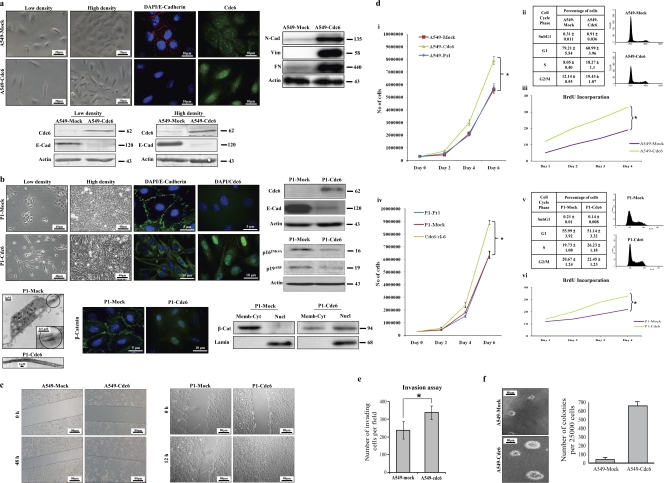
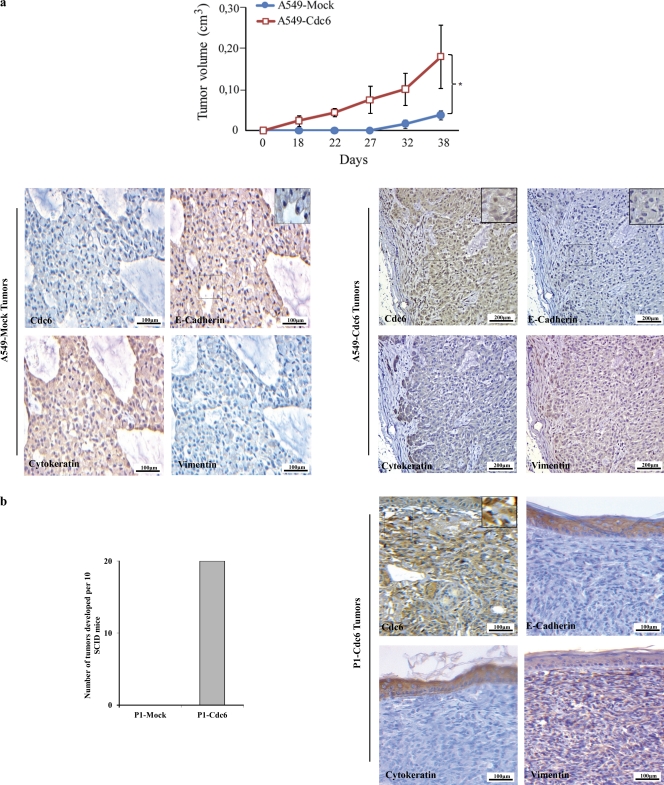
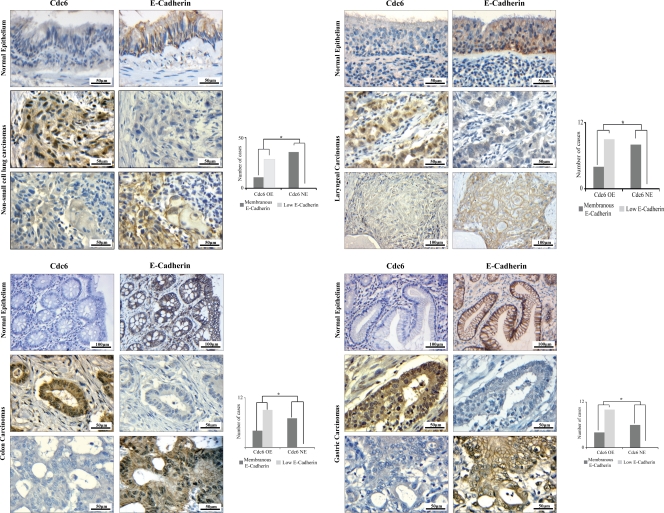
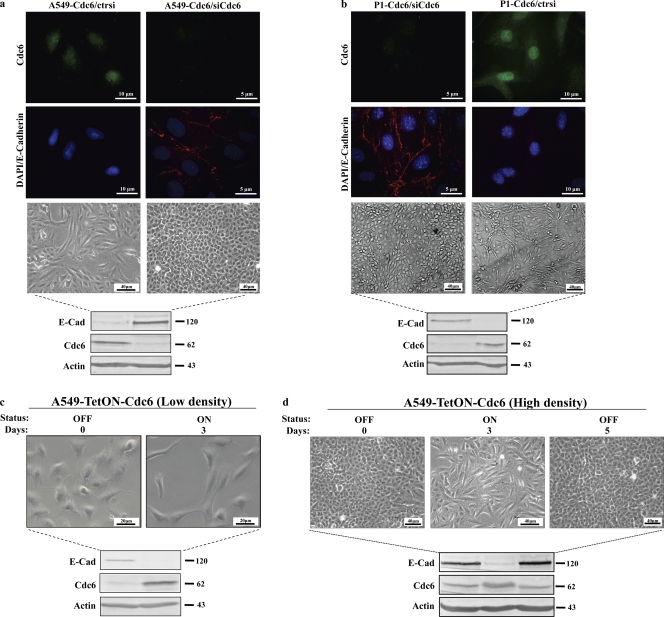
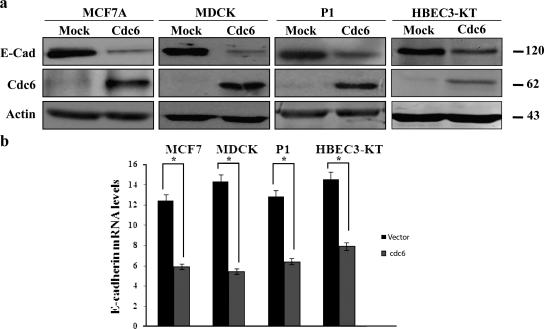
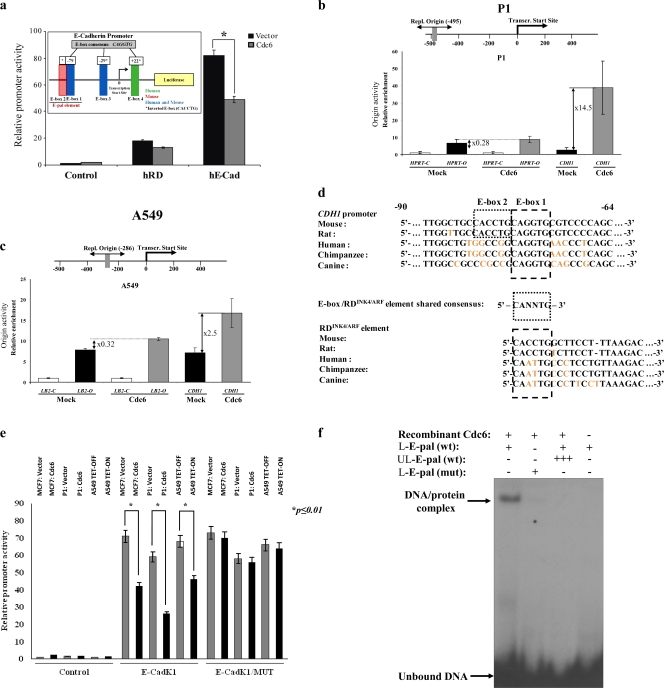
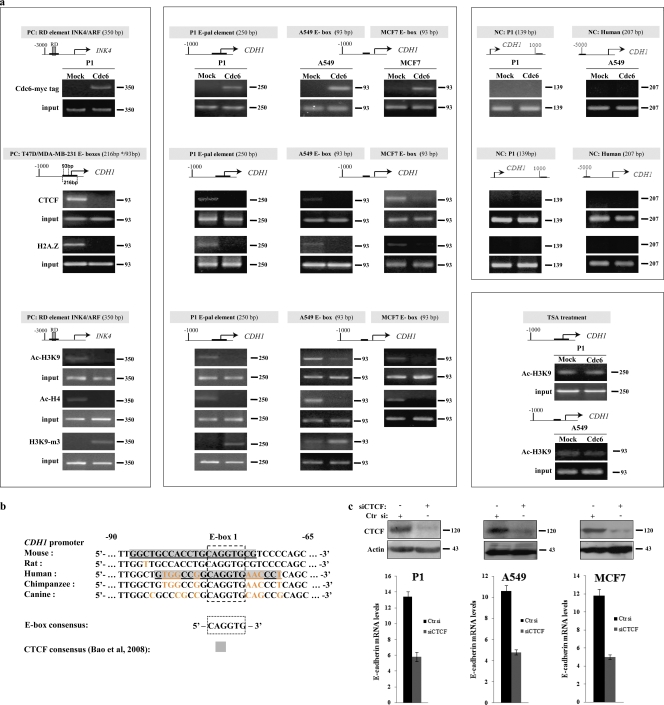
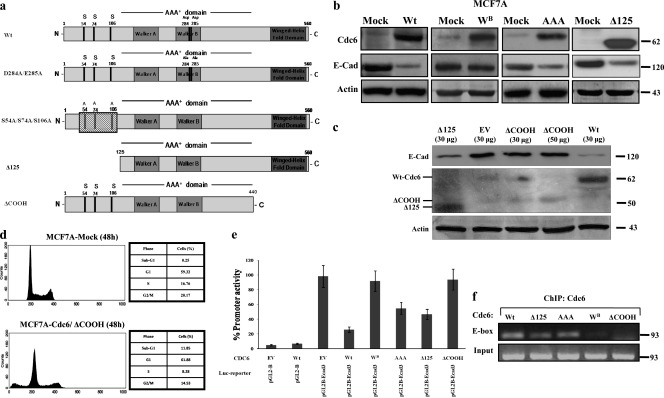
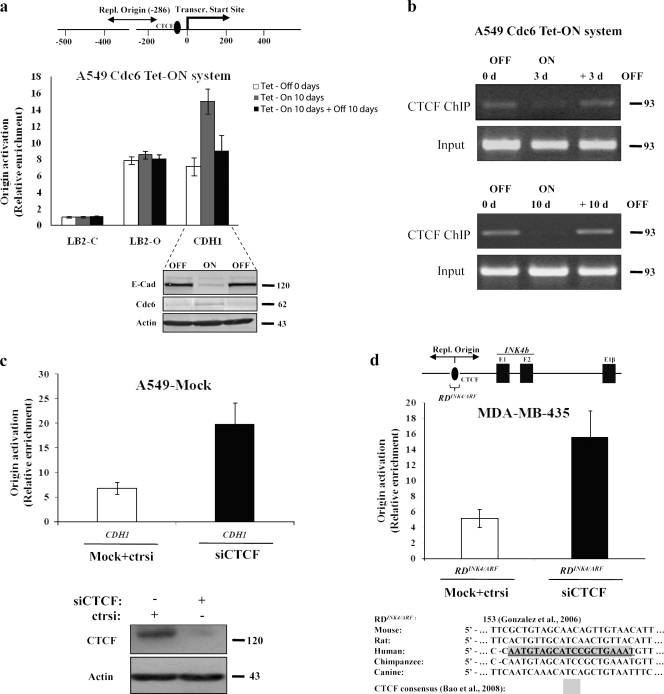
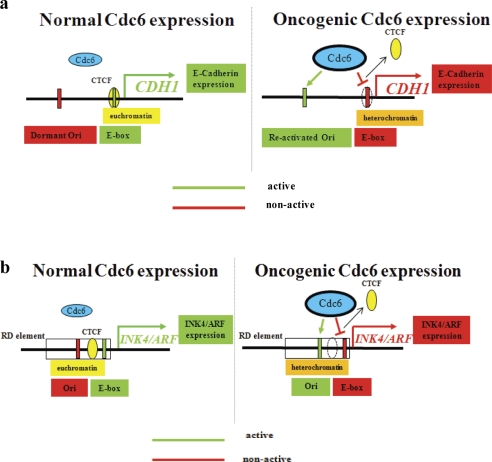
E-cadherin (CDH1) loss occurs frequently in carcinogenesis, contributing to invasion and metastasis. We observed that mouse and human epithelial cell lines overexpressing the replication licensing factor Cdc6 underwent phenotypic changes with mesenchymal features and loss of E-cadherin. Analysis in various types of human cancer revealed a strong correlation between increased Cdc6 expression and reduced E-cadherin levels. Prompted by these findings, we discovered that Cdc6 repressed CDH1 transcription by binding to the E-boxes of its promoter, leading to dissociation of the chromosomal insulator CTCF, displacement of the histone variant H2A.Z, and promoter heterochromatinization. Mutational analysis identified the Walker B motif and C-terminal region of Cdc6 as essential for CDH1 transcriptional suppression. Strikingly, CTCF displacement resulted in activation of adjacent origins of replication. These data demonstrate that Cdc6 acts as a molecular switch at the E-cadherin locus, linking transcriptional repression to activation of replication, and provide a telling example of how replication licensing factors could usurp alternative programs to fulfill distinct cellular functions.


Figures

Figure 1.
Figure 1.
Overexpression of Cdc6 represses E-cadherin. (a) Loss of membranous localization, decreased expression of E-cadherin (E-cad), and spindle morphology in A549-Cdc6 cells. The mesenchymal markers N-cadherin (N-cad), vimentin (vim), and fibronectin (FN) are up-regulated and accompany Cdc6 overexpression. (b) Similar morphological features and E-cadherin loss appear in P1-Cdc6 cells along with decreased p16INK4A and p19ARF levels. Ultrastructural features, such as loss of desmosomes (circled inset photo) and elongated shape, further confirm morphological changes. Shift of membranous (Memb) β-catenin (β-cat) to the cytoplasm (Cyt) and nucleus (Nucl) of Cdc6 cells. Because the INK4 locus is deleted in A549 cells (Pineau et al., 2003), the impact of Cdc6 overexpression on INK4 products could not be determined. (c) A549- and P1-hCdc6 cells migrate faster than corresponding control (Mock) cells for the indicated time points after an induced scratch. (d) Cdc6 overexpression confers a growth advantage to P1 and A549 cells. (i and iv) Growth curves of A549- and P1-Cdc6 Mock and parental (Prl) cells (*, P ≤ 0.01). (ii–vi) Tables depict FACS results (ii and v), whereas line plots show BrdU incorporation of the same P1- and A549-Cdc6 cells (iii and vi) in comparison with their corresponding control (Mock) cells (*, P ≤ 0.01). (e) A549-Cdc6 cells are more invasive in the matrigel assay than the corresponding A549-Mock cells. Mean values from triplicate fields are plotted with SDs (*, P < 0.05). (f) A549-Cdc6 clones form more and larger colonies than the A549-Mock cells in soft agar assay (P < 0.001). Molecular markers are given in kilodaltons.
Figure 2.
Figure 2.
Tumor formation of grafted A549- and P1-Cdc6 cells in SCID mice. (a) Subcutaneously injected A549-Cdc6 cells form faster tumors than the Mock cells. Graph shows a single round of five animals (7-wk-old male SCID mice) per each cell type, which were subcutaneously injected on the left dorsal flank. Presence of E-cadherin and cytokeratin staining in A549-Mock–derived tumors. Absence of E-cadherin and partial intermediate filament shift from cytokeratin to vimentin in tumors generated from A549-Cdc6–grafted cells in SCID mice. The asterisk denotes a statistically significant result. (b) Only the P1-Cdc6 cells formed tumors because the P1-Mock cells are nontumorigenic. Graph shows a single round of five animals (7-wk-old male SCID mice) per each cell type, which were subcutaneously injected at two sites in the abdominal region. Absence of E-cadherin and complete intermediate filament shift from cytokeratin to vimentin in tumors generated from P1-Cdc6–grafted cells in SCID mice. Insets depict magnifications of the dotted rectangular areas. Error bars indicate SDs (*, P < 0.01).
Figure 3.
Figure 3.
Inverse relationship between E-cadherin and Cdc6 expression in human tumors. Immunohistochemical analysis on serial sections from human lung, laryngeal, colon, and gastric carcinomas. Graphs plot the number of individual human tumors that exhibit membranous E-cadherin versus cytoplasmic/reduced E-cadherin and their relation to the levels (OE, overexpressed; NE, normal expression) of Cdc6 (*, P < 0.001). Corresponding normal epithelia that serve as internal positive controls for E-cadherin and negative controls for Cdc6 in relation to their corresponding adjacent carcinomas are also shown.
Figure 4.
Figure 4.
Cdc6-mediated E-cadherin suppression is reversible. (a) Cdc6 siRNA in A549-Cdc6 cells restored the epithelial E-cadherin (E-Cad)–positive phenotype. (b) Similar effect in P1-Cdc6 cells. (c and d) Induction of Cdc6 expression in the A549–Tet-ON–inducible cells (for 3 d) led to E-cadherin down-regulation and to a spindle phenotype that are reversed after shutting down Cdc6 (for an additional 5 d). A549–Tet-ON Cdc6 low density cells were continuously passaged to avoid aggregation. ctrsi, control siRNA. Molecular markers are given in kilodaltons.
Figure 5.
Figure 5.
Cdc6 transcriptionally represses E-cadherin. (a and b) E-cadherin (E-Cad) protein (a) and mRNA (b) level reduction in MCF7A, MDCK, P1, and HBEC3-KT cells after transient Cdc6 expression. The asterisk denotes a statistically significant result. Error bars indicate SDs. Molecular markers are given in kilodaltons.
Figure 6.
Figure 6.
Cdc6 represses E-cadherin by binding the E-boxes of the CDH1 promoter. (a) Decreased activity of the CDH1 promoter-driven luciferase reporter when cotransfected with Cdc6 in MCF7A cells (Table S6). The positive control was the regulatory domain (RD) of INK4/ARF. (inset) CDH1 promoter diagram with the E-boxes positioned (Peinado et al., 2004) and numbered as per the human CDH1 sequence (Berx and van Roy, 2009). The asterisk denotes a statistically significant result. hRD, human RD; hE-Cad, human E-cadherin. (b and c) Production of nascent DNA from a replication (Repl.) origin adjacent to the CDH1 promoter in P1 (b)- and A549 (c)-Cdc6 and corresponding Mock cells. (b) Histograms depicting the activation of a cryptic replication origin identified next to the promoter of the mouse CDH1 gene, in P1-Cdc6 cells, in comparison with the corresponding Mock ones. The well-established replication origin of the HPRT gene was used as an internal control. Transcr., transcription. (c) Histograms depicting increased activation of an already active replication origin identified next to the promoter of the human CDH1 gene, in A549-Cdc6 cells, in comparison with the corresponding Mock ones. The well-established replication origin of the Lamin B2 gene was used as an internal control (C, control region, distal origin-lacking region; O, well-characterized replication origin in the HPRT and Lamin B2 genes). Values are expressed as relative enrichment of the origin-containing region compared with the origin-lacking regions and represent five experiments ± 1 SD. Numbers next to the bars in the histograms denote fold increase. Numbers on the axis above the histograms denote distance in base pairs. (d) Sequence homology based on a shared consensus between the E-cadherin E-box promoter and the RDIKN4/ARF element in mammals (numbering as per the human CDH1 sequence; Berx and van Roy, 2009). Divergent nucleotides are colored. Note the rodent-specific presence of the E-pal element (E-box 2 [inverted E-box sequence]/E-box 1 sequence). (e) Luciferase assay of human CDH1 promoter construct with wild-type or mutated E-boxes (1, 3, and 4; Table S6) cotransfected with Cdc6 in MCF7A, P1, and induced A549–Tet-ON cells. (f) Radioactive EMSA with a full-length human recombinant Cdc6 protein (Table S5). The triple plus sign denotes addition in excess of oligonucleotide. L, labeled oligonucleotide; UL, unlabeled oligonucleotide; wt, wild type; mut, mutant. Error bars indicate SDs.
Figure 7.
Figure 7.
Cdc6 triggers CDH1 promoter heterochromatinization by displacing the chromosomal insulator CTCF and the variant histone H2A.Z. (a) ChIP for myc-tagged Cdc6 binding to the mouse E-pal element and human E-box 1 and 3, CTCF and H2A.Z histone displacement, hypoacetylation of histones H3 and H4, and increase in H3K9me3 in mouse and human cells (middle box). T47D and MDA-MB-231 were used as control cell lines (Witcher and Emerson, 2009; similar results were obtained with the primers encompassing the 216-bp region described by Witcher and Emerson [2009]; Table S3 and not depicted). The RDIKN4/ARF element (PC, positive control; left box) and regions located 1.05 kb downstream of the E-pal element and 5 kbp upstream of the E-box (NC, negative control; top right box) were used as positive and negative controls, respectively. (bottom right box) TSA prevents Cdc6-induced deacetylation of the CDH1 promoter. (b) Sequence homology between mammalian E-cadherin promoter regions encompassing E-box 1. CTCF-binding element is highlighted in gray. Divergent nucleotides are colored. (c) CTCF silencing leads to E-cadherin transcriptional repression. Ctr si, control siRNA. Error bars indicate SDs. Molecular markers are given in kilobases (a) and kilodaltons (c).
Figure 8.
Figure 8.
The Walker B motif and the C-terminal domain are essential for CDH1 suppression. (a) Schematic presentation of Cdc6 mutants. Lined box denotes mutation of serines at codons 54, 74, and 106. N, N terminus; C, C terminus. (b) Effects of the Cdc6-WB, Cdc6-AAA, and Cdc6-Δ125 mutants on E-cadherin (E-Cad) protein level in MCF7A cells. (c) Inability of Cdc6-ΔCOOH to down-regulate E-cadherin. Cdc6-ΔCOOH mutant protein levels are considerably lower than the Cdc6-Δ125, indicating that the presence of the C-terminal domain is crucial for its stability. EV, empty vector. (d) Flow cytometric analysis of Cdc6-ΔCOOH (Table S6)–transfected MCF7A cells depicting increased apoptosis (increased sub-G1 phase). (e) Luciferase (Luc) activity of the CDH1 promoter-driven luciferase reporter when cotransfected with wild-type (Wt) and Cdc6 mutants in MCF7A cells. (f) ChIP assay of the Cdc6 mutants in MCF7A cells. The binding capacity of the mutants followed their repressive activity (e). Error bars indicate SDs. Molecular markers are given in kilodaltons (b and c) and kilobases (f).
Figure 9.
Figure 9.
CTCF displacement links Cdc6 overexpression with suppression of CDH1 and increased replication origin activity. (a) E-cadherin (E-Cad) levels follow the activity of the replication (Repl.) origin located in the human CDH1 promoter in induced and noninduced A549-Cdc6–Tet-ON cells (C, distal origin-lacking region; O, characterized Lamin B2 gene replication origin; Transcr., transcription; Falaschi et al., 2007). (b) CTCF displacement from the CDH1 promoter follows Cdc6 induction in A549-Cdc6–Tet-ON cells. CTCF ChIP assay in A549-Cdc6–Tet-ON cells induced and shut down at different time points. (c) Silencing of CTCF in A549-Mock cells activates the identified at the CDH1 locus replication origin. (d) CTCF silencing in INK4A/ARF-expressing MDA-MB-435 cells activates the reported adjacent replication origin (Gonzalez et al., 2006). crtsi, control siRNA. Error bars indicate SDs. Molecular markers are given in kilodaltons (a and c) and kilobases (b).
Figure 10.
Figure 10.
Model describing the ability of oncogenic Cdc6 to act as a molecular switch. (a and b) Cdc6 acting as a molecular switch at the CDH1 (a) and INK4/ARF (b) locus (see Discussion). Ori, replication origin.

Similar articles

Cited by

References

    1. Antequera F. 2004. Genomic specification and epigenetic regulation of eukaryotic DNA replication origins. EMBO J. 23:4365–4370 10.1038/sj.emboj.7600450 - DOI - PMC - PubMed
    1. Bao L., Zhou M., Cui Y. 2008. CTCFBSDB: a CTCF-binding site database for characterization of vertebrate genomic insulators. Nucleic Acids Res. 36(Suppl. 1):D83–D87 10.1093/nar/gkm875 - DOI - PMC - PubMed
    1. Bartkova J., Rezaei N., Liontos M., Karakaidos P., Kletsas D., Issaeva N., Vassiliou L.V., Kolettas E., Niforou K., Zoumpourlis V.C., et al. 2006. Oncogene-induced senescence is part of the tumorigenesis barrier imposed by DNA damage checkpoints. Nature. 444:633–637 10.1038/nature05268 - DOI - PubMed
    1. Bergström R., Whitehead J., Kurukuti S., Ohlsson R. 2007. CTCF regulates asynchronous replication of the imprinted H19/Igf2 domain. Cell Cycle. 6:450–454 10.4161/cc.6.4.3854 - DOI - PubMed
    1. Berx G., van Roy F. 2009. Involvement of members of the cadherin superfamily in cancer. Cold Spring Harb. Perspect. Biol. 1:a003129 10.1101/cshperspect.a003129 - DOI - PMC - PubMed

Publication types

MeSH terms