. 2011 Dec 26;195(7):1141-57.
doi: 10.1083/jcb.201108159.

Smaug1 mRNA-silencing foci respond to NMDA and modulate synapse formation

Affiliations

Smaug1 mRNA-silencing foci respond to NMDA and modulate synapse formation

María Verónica Baez et al. J Cell Biol. .

Abstract

Mammalian Smaug1/Samd4A is a translational repressor. Here we show that Smaug1 forms mRNA-silencing foci located at postsynapses of hippocampal neurons. These structures, which we have named S-foci, are distinct from P-bodies, stress granules, or other neuronal RNA granules hitherto described, and are the first described mRNA-silencing foci specific to neurons. RNA binding was not required for aggregation, which indicates that S-foci formation is not a consequence of mRNA silencing. N-methyl-D-aspartic acid (NMDA) receptor stimulation provoked a rapid and reversible disassembly of S-foci, transiently releasing transcripts (the CaMKIIα mRNA among others) to allow their translation. Simultaneously, NMDA triggered global translational silencing, which suggests the specific activation of Smaug1-repressed transcripts. Smaug1 is expressed during synaptogenesis, and Smaug1 knockdown affected the number and size of synapses, and also provoked an impaired response to repetitive depolarizing stimuli, as indicated by a reduced induction of Arc/Arg3.1. Our results suggest that S-foci control local translation, specifically responding to NMDA receptor stimulation and affecting synaptic plasticity.


Figures

Figure 1.
Figure 1.
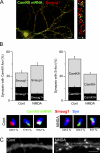
Mammalian Smaug1 is expressed in neurons and forms mRNA-silencing foci. Cultured hippocampal neurons were stained for the indicated molecules. (A) Bars: (top) 5 µm; (bottom) 1 µm. (B) A magnification of an isolated dendrite is shown. Bar, 1 µm. (C) Hippocampal neurons were exposed to cycloheximide (CHX) or puromycin (PURO) during 3 h. The size and number of Smaug1 foci were measure in 100× confocal z-stack images and the area occupied by Smaug1 granules in 20 randomly selected dendrite fragments was calculated for each treatment. A moderate increase of Smaug1 granular signal was observed upon puromycin treatment, whereas exposure to cycloheximide provokes a moderate reduction of Smaug1 granular signal. Error bars indicate standard deviation.
Figure 2.
Figure 2.
S-foci are independent of PBs. (A) Neurons were treated with the indicated siRNA, and the presence of S-foci and PBs visualized by DCP1a staining was analyzed in 20 randomly selected dendrite fragments (400 µm total length) for each treatment. Normalized values from two independent experiments are plotted. Representative IF images for the indicated molecules upon the distinct treatments are shown. Bottom, depletion of PBs visualized by RCK or Hedls relative to normal levels. In all cases, knockdown of Hedls or RCK provokes PB disruption without affecting the presence of S-foci. Error bars indicate standard deviation. (B) U2OS cells were transfected with Smaug1-ECFP and immunostained for the indicated PB markers. Close vicinity between S-foci and PBs is frequent (Fig. S2 A). The bottom row shows enlarged views of the boxed regions. (C) U2OS cells were treated with the indicated siRNAs, then transfected with the Smaug1-ECFP construct, and stained for DCP1a. Depletion of Hedls, Rck/p54, and 4ET was confirmed by Western blotting or RT-PCR (Fig. S2, B and C), and their effect on PB integrity was confirmed by IF (Fig. S2 D). Representative cells are depicted, and the percentage of the transfected cells with S-foci in each treatment is indicated. Similar results were observed in three independent experiments. The bottom row shows enlarged views of the boxed regions. (D) U2OS cells were transfected with the indicated constructs, and the proportion of the transfected cells with foci is indicated. One representative experiment out of five is shown. (E) U2OS cells expressing the indicated constructs were treated with cycloheximide (CHX), emetine (EME), puromycin (PURO), or hippuristanol (HIP) during 4 h, and stained for DCP1a. The proportion of cells with foci relative to that of untreated cells for each construct and the proportion of cells with PBs identified by DCP1a are plotted. S-foci and PBs disassembled upon polysome stabilization by cycloheximide or emetine, whereas ΔSAM foci were fully resistant. Normalized values from 50 cells from a representative experiment out of three are shown. Error bars in E represents the standard deviation from triplicate coverslips. Bars: (A) 1 µm; (B–D) 10 µm.
Figure 3.
Figure 3.
Smaug1 foci at the postsynapse. (A and B) Magnifications of isolated dendritic spines showing endogenous Smaug1 (A) or transfected Smaug1-ECFP (B), and the indicated markers. Endogenous or transfected Smaug1 form granules located at the postsynapse. (C) Smaug1 and FMRP were simultaneously stained in cultured neurons, and their presence in the synapses was evaluated. (D) Adult hippocampus slices were stained with the indicated antibodies. (D, top left) Tubulin βIII. (D, bottom left) A magnification of the CA1 region, including cell bodies and dendrites is shown. PI, rabbit preimmune serum. (D, right) A representative magnification of the CA3 region showing four S-foci associated with a synapse. Enlarged views of the boxed regions are shown below. (E) Synaptoneurosomes (Sn) were isolated from adult hippocampus (Hipp) by sucrose gradient centrifugation, then separated in a soluble extract (Sol) that was enriched in presynaptic components and that excluded PSD95, and a postsynaptic density-enriched fraction (PSD). Smaug1 is detected in the synaptoneurosomal and PSD fractions, and is absent from the soluble presynaptic fraction. Bars: (A and B) 1 µm; (D, left) 5 µm; (D, right) 1 µm.
Figure 4.
Figure 4.
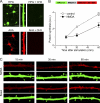
S-foci located at postsynaptic sites respond to depolarization. Hippocampal neurons were exposed to KCl as indicated in Materials and methods during the indicated time periods, and stained for the indicated proteins. (A) Representative dendrite fragments from control or depolarized neurons are shown. Synaptic Smaug1 signal is reduced in depolarized neurons. Bar, 1 µm. (B) The presence of S-foci in ∼600 synapses from 40 random-selected dendritic fragments, and the S-foci size from 100 random selected S-foci was evaluated at the indicated time points. Normalized values and standard deviation from duplicates are shown (error bars). (C) The number of S-foci in dendrite shafts after a 10-min KCl pulse was evaluated in triplicate experiments. The number of synapses remained constant through the analyzed time points (not depicted).
Figure 5.
Figure 5.
S-foci respond to NMDAR activation. (A–C) Hippocampal neurons were exposed to KCl during 10 min in the presence or absence of the indicated drugs, and the number of synapses with associated Smaug1 (A and B) or FMRP granules (C) was evaluated. KYNA, kynurenic acid; PICRO, picrotoxin. (D) Neurons were pulsed with NMDA as indicated in Materials and methods and allowed to recover, and the presence of S-foci at the synapses was analyzed. S-foci size normalized to control values at each time point is indicated. Similar results were observed in three independent experiments including different time points. (D, bottom) Representative IF images corresponding to the experiments depicted. Bar, 1 µm. (E and F) Neurons were exposed to KCl or NMDA in the presence of the indicated drugs, and the presence of S-foci associated to synapses was evaluated as in Fig. 4 B. E-AM, EGTA-AM; W, wortmannin; KN, KN93; LY, LY294002. Approximately 100 dendritic fragments from 20 neurons were analyzed for each data point. Error bars indicate standard deviation from triplicate coverslips in a representative experiment.
Figure 6.
Figure 6.
S-foci dissolution upon synaptic stimulation requires polysome assembly. (A–C) Hippocampal neurons were exposed to KCl or NMDA as indicated in Materials and methods, in the presence or absence of the indicated translation inhibitors. CHX, cycloheximide; PURO, puromycin; Hip, hippuristanol. (A and B) The proportion of synapses containing S-foci relative to basal levels from three independent experiments is plotted, and IF images of representative dendritic fragments for the indicated treatments are depicted. Bars, 1 µm. (C) TTX-silenced hippocampal cells were stimulated with NMDA in the presence or absence of cycloheximide or emetine (EME), which stall polysomes, and allowed to recover during 60 min, in the presence or absence of puromycin, which disrupts polysomes. S-foci were analyzed as in Figs. 4 and 5. The continuous inhibition of protein synthesis does not affect S-foci reassembly. Similar results were obtained in a duplicate experiment. Approximately 50 dendritic fragments (total length, 750 µm) from 20 neurons were analyzed for each data point. Error bars indicate standard deviation.
Figure 7.
Figure 7.
CaMKIIα mRNA associates to S-foci in an activity-dependent manner. (A) CaMKIIα mRNA and Smaug1 were simultaneously detected by FISH and IF, respectively. Between 40 and 60% of CaMKIIα mRNA granules colocalize or are in close contact with S-foci. A representative dendrite is shown. (B) Neurons were stimulated with NMDA during 5 min and stained for CaMKIIα mRNA, Smaug1, and synapsin. The number of CaMKIIα mRNA granules at the synapse, associated to S-foci (S+) or not (S−), and the number of synaptic S-foci, associated to CaMKIIα granules or not, are plotted. Approximately 300 synapses from 20 random selected neurons were analyzed in each case. Error bars indicate standard deviation. (B, bottom) Representative immunofluorescent images of synaptic S-foci and CaMKIIα mRNA granules either colocalizing or not colocalizing for each condition. The percentage relative to the total number of synapses and standard error is indicated in each case. (C) Neurons were stimulated with NMDA during 5 min and immunostained for CaMKIIα 30 min after the pulse. Representative dendritic fragments showing an increase of CaMKII signal at the dendritic spine are depicted. Bars: (A, left) 10 µm; (A, right) 1 µm; (B) 1 µm; (C) 2 µm.
Figure 8.
Figure 8.
NMDAR activation inhibits global translation at the dendrite. The FUNCAT strategy was used as indicated in Materials and methods. (A) Cultured neurons were pulsed with HPG or AHA in the presence or absence of cycloheximide (CHX), and the incorporated modified amino acids were covalently coupled to Alexa Fluor 488 or 595. Translation inhibition completely abrogated the signal. Insets show representative dendrite fragments. Bars: (left) 20 µm; (right) 1 µm. (B) HPG and AHA were used sequentially to evaluate the protein synthesis rate before and after the stimulus, respectively. HPG and AHA signal intensities were measured in ∼40 dendrite fragments (total length, 800 µm) for each time point. AHA incorporation at different times after stimulation relative to basal HPG incorporation is plotted. One representative experiment out of four is depicted; error bars indicate the standard deviation from triplicate coverslips. (C) Representative dendrite fragments showing the NMDA inhibitory effect on protein synthesis in dendrite shafts and spines. Bar, 1 µm.
Figure 9.
Figure 9.
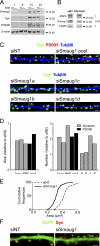
Smaug1 knockdown affects synapse size and number. (A) Western blot of postnuclear protein extracts (10 or 5 µg) from cultured hippocampal neurons at 1, 8, 15, or 23 d in vitro with the indicated antibodies. (B–F) Neurons were treated with the indicated siRNAs as described in Materials and methods. (B) Smaug1, Map2, and tubulin βIII levels were evaluated by Western blotting. Signal intensity relative to that of β-actin is indicated. An siRNA against Smaug 2 had no effect on Smaug1 levels (not depicted). (C) Representative dendrite fragments stained with the indicated synapse or cytoskeleton markers are shown. (D and E) The size and number of synaptic puncta identified by simultaneous or independent staining of PSD95 and synapsin was measure as indicated in Materials and methods. (D) Summary of the normalized synapse size and number relative to that of siNT-treated neurons in three independent experiments with the siSmaug1 pool, and in a representative experiment comparing the four different siRNA. (E) Synapse size distribution in a representative experiment with the siSmaug1 pool. Random selected dendritic fragments from 10 neurons (total length, 5,000 µm) were analyzed in each case. (F) Neurons were transfected with ECFP and treated with the indicated siRNAs as indicated in Materials and methods. Representative dendrite fragments stained for ECFP and synapsin are shown. Dendritic spines were more numerous upon Smaug1 depletion. Bars, 2 µm.
Figure 10.
Figure 10.
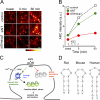
Smaug1 knockdown affects neuron excitability. Neurons were treated with the indicated siRNA and exposed to a repeated depolarizing stimulus. (A) Arc/Arg3.1 was detected by IF at the indicated times and shown in glow scale. Bar, 20 µm. (B) Integrated intensity in the cell bodies from 100 neurons from duplicate coverslips was quantified in 20× micrographs. A duplicate experiment with similar results was performed. (C) Hypothetical model for a role of Smaug1 in local translation at the synapse and its regulation by NMDA. CaMKIIα mRNA and other repressed transcripts would be associated with the S-foci, likely as single molecules (see Discussion; Mikl et al., 2011). Upon NMDAR stimulation, the S-foci dissolve, likely facilitating the translation of selected mRNA. Simultaneously, local translation is globally repressed. Local translation of CaMKIIα is known to mediate synapse strength, and additional unknown transcripts regulated by Smaug1 may also contribute. (D) Putative SREs are present in the 3′ UTR of CaMKIIα mRNAs from distinct species. In addition, conserved putative SREs are present at the coding region (not depicted).

Similar articles

Cited by

References

    1. Aakalu G., Smith W.B., Nguyen N., Jiang C., Schuman E.M. 2001. Dynamic visualization of local protein synthesis in hippocampal neurons. Neuron. 30:489–502 10.1016/S0896-6273(01)00295-1 - DOI - PubMed
    1. Anderson P., Kedersha N. 2009. RNA granules: post-transcriptional and epigenetic modulators of gene expression. Nat. Rev. Mol. Cell Biol. 10:430–436 10.1038/nrm2694 - DOI - PubMed
    1. Antar L.N., Afroz R., Dictenberg J.B., Carroll R.C., Bassell G.J. 2004. Metabotropic glutamate receptor activation regulates fragile x mental retardation protein and FMR1 mRNA localization differentially in dendrites and at synapses. J. Neurosci. 24:2648–2655 10.1523/JNEUROSCI.0099-04.2004 - DOI - PMC - PubMed
    1. Ashraf S.I., McLoon A.L., Sclarsic S.M., Kunes S. 2006. Synaptic protein synthesis associated with memory is regulated by the RISC pathway in Drosophila. Cell. 124:191–205 10.1016/j.cell.2005.12.017 - DOI - PubMed
    1. Atkins C.M., Nozaki N., Shigeri Y., Soderling T.R. 2004. Cytoplasmic polyadenylation element binding protein-dependent protein synthesis is regulated by calcium/calmodulin-dependent protein kinase II. J. Neurosci. 24:5193–5201 10.1523/JNEUROSCI.0854-04.2004 - DOI - PMC - PubMed

Publication types

MeSH terms

Substances