

Extensive linkage disequilibrium and parallel adaptive divergence across threespine stickleback genomes
- PMID: 22201169
- PMCID: PMC3233713
- DOI: 10.1098/rstb.2011.0245
Extensive linkage disequilibrium and parallel adaptive divergence across threespine stickleback genomes
Abstract
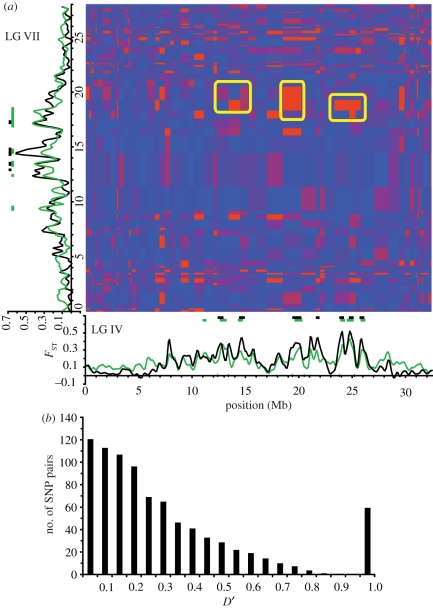
Population genomic studies are beginning to provide a more comprehensive view of dynamic genome-scale processes in evolution. Patterns of genomic architecture, such as genomic islands of increased divergence, may be important for adaptive population differentiation and speciation. We used next-generation sequencing data to examine the patterns of local and long-distance linkage disequilibrium (LD) across oceanic and freshwater populations of threespine stickleback, a useful model for studies of evolution and speciation. We looked for associations between LD and signatures of divergent selection, and assessed the role of recombination rate variation in generating LD patterns. As predicted under the traditional biogeographic model of unidirectional gene flow from ancestral oceanic to derived freshwater stickleback populations, we found extensive local and long-distance LD in fresh water. Surprisingly, oceanic populations showed similar patterns of elevated LD, notably between large genomic regions previously implicated in adaptation to fresh water. These results support an alternative biogeographic model for the stickleback radiation, one of a metapopulation with appreciable bi-directional gene flow combined with strong divergent selection between oceanic and freshwater populations. As predicted by theory, these processes can maintain LD within and among genomic islands of divergence. These findings suggest that the genomic architecture in oceanic stickleback populations may provide a mechanism for the rapid re-assembly and evolution of multi-locus genotypes in newly colonized freshwater habitats, and may help explain genetic mapping of parallel phenotypic variation to similar loci across independent freshwater populations.
Figures
Similar articles
-
Repeated Selection of Alternatively Adapted Haplotypes Creates Sweeping Genomic Remodeling in Stickleback.Genetics. 2018 Jul;209(3):921-939. doi: 10.1534/genetics.117.300610. Epub 2018 May 24. Genetics. 2018. PMID: 29794240 Free PMC article.
-
Evolution of stickleback in 50 years on earthquake-uplifted islands.Proc Natl Acad Sci U S A. 2015 Dec 29;112(52):E7204-12. doi: 10.1073/pnas.1512020112. Epub 2015 Dec 14. Proc Natl Acad Sci U S A. 2015. PMID: 26668399 Free PMC article.
-
Population genomics of parallel adaptation in threespine stickleback using sequenced RAD tags.PLoS Genet. 2010 Feb 26;6(2):e1000862. doi: 10.1371/journal.pgen.1000862. PLoS Genet. 2010. PMID: 20195501 Free PMC article.
-
Genetics and ecological speciation.Proc Natl Acad Sci U S A. 2009 Jun 16;106 Suppl 1(Suppl 1):9955-62. doi: 10.1073/pnas.0901264106. Epub 2009 Jun 15. Proc Natl Acad Sci U S A. 2009. PMID: 19528639 Free PMC article. Review.
-
Divergence hitchhiking and the spread of genomic isolation during ecological speciation-with-gene-flow.Philos Trans R Soc Lond B Biol Sci. 2012 Feb 5;367(1587):451-60. doi: 10.1098/rstb.2011.0260. Philos Trans R Soc Lond B Biol Sci. 2012. PMID: 22201174 Free PMC article. Review.
Cited by
-
Genome sequencing of Metrosideros polymorpha (Myrtaceae), a dominant species in various habitats in the Hawaiian Islands with remarkable phenotypic variations.J Plant Res. 2016 Jul;129(4):727-736. doi: 10.1007/s10265-016-0822-3. Epub 2016 Apr 6. J Plant Res. 2016. PMID: 27052216
-
Genome-wide association analyses reveal polygenic genomic architecture underlying divergent shell morphology in Spanish Littorina saxatilis ecotypes.Ecol Evol. 2019 Aug 9;9(17):9427-9441. doi: 10.1002/ece3.5378. eCollection 2019 Sep. Ecol Evol. 2019. PMID: 31534666 Free PMC article.
-
Genetic mapping and comparative genomics to inform restoration enhancement and culture of southern flounder, Paralichthys lethostigma.BMC Genomics. 2018 Feb 23;19(1):163. doi: 10.1186/s12864-018-4541-0. BMC Genomics. 2018. PMID: 29471804 Free PMC article.
-
Long distance linkage disequilibrium and limited hybridization suggest cryptic speciation in atlantic cod.PLoS One. 2014 Sep 26;9(9):e106380. doi: 10.1371/journal.pone.0106380. eCollection 2014. PLoS One. 2014. PMID: 25259573 Free PMC article.
-
Local Heterozygosity Effects on Nestling Growth and Condition in the Great Cormorant.Evol Biol. 2015;42(4):452-460. doi: 10.1007/s11692-015-9339-2. Epub 2015 Jul 22. Evol Biol. 2015. PMID: 26586922 Free PMC article.
References
-
- Fisher R. A. 1958. The genetical theory of natural selection. New York, NY: Dover
-
- Wright S. 1978. Evolution and the genetics of populations. Chicago, IL: University of Chicago Press
-
- Lewontin R. C., Kojima K. 1960. The evolutionary dynamics of complex polymorphisms. Evolution 14, 458–47210.2307/2405995 (doi:10.2307/2405995) - DOI - DOI
-
- Slatkin M. 2008. Linkage disequilibrium—understanding the evolutionary past and mapping the medical future. Nat. Rev. Genet. 9, 477–48510.1038/nrg2361 (doi:10.1038/nrg2361) - DOI - DOI - PMC - PubMed
Publication types
MeSH terms
Grants and funding
LinkOut - more resources
Full Text Sources
Research Materials
