

Coalescent patterns for chromosomal inversions in divergent populations
- PMID: 22201172
- PMCID: PMC3233714
- DOI: 10.1098/rstb.2011.0246
Coalescent patterns for chromosomal inversions in divergent populations
Abstract
Chromosomal inversions allow genetic divergence of locally adapted populations by reducing recombination between chromosomes with different arrangements. Divergence between populations (or hybridization between species) is expected to leave signatures in the neutral genetic diversity of the inverted region. Quantitative expectations for these patterns, however, have not been obtained. Here, we develop coalescent models of neutral sites linked to an inversion polymorphism in two locally adapted populations. We consider two scenarios of local adaptation: selection on the inversion breakpoints and selection on alleles inside the inversion. We find that ancient inversion polymorphisms cause genetic diversity to depart dramatically from neutral expectations. Other situations, however, lead to patterns that may be difficult to detect; important determinants are the age of the inversion and the rate of gene flux between arrangements. We also study inversions under genetic drift, finding that they produce patterns similar to locally adapted inversions of intermediate age. Our results are consistent with empirical observations, and provide the foundation for quantitative analyses of the roles that inversions have played in speciation.
Figures
 ,
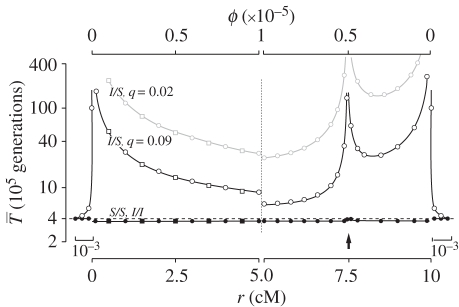
,  , filled circles), or between arrangements (
 , open circles), for the cases where q = 0.09 (black lines) or q = 0.02 (grey line). The breakpoints are located at 0 and 10 cM, and an arrow indicates the position of one locally adapted allele. Curves are based on analytical results, and the circles show simulation results (106 runs each). Squares show evaluations from the generating function method (see text). The horizontal dashed line shows the expectation for a neutral subdivided population. In both models, the patterns for the opposite half of the inversion (not shown) are symmetric to the ones presented. Shown on both sides, patterns for a small portion of the flanking region with normal recombination patterns.
 ,
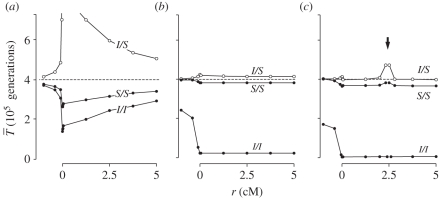
,  , filled circles), or different arrangements (
 , open circles). (a) A neutral inversion in a single population, at frequency x0 = 0.5. (b) An inversion with locally adapted breakpoints. (c) An inversion that carries two locally adapted alleles. In (b) and (c), T* = 0.1 and q = 0.09. The breakpoints are at 0 and 10 cM, and an arrow indicates the position of one locally adapted allele. The points show simulation results (106 runs each), and lines are added for clarity purposes only. The dashed line shows the SNM for (a), and a neutral subdivided population for (b) and (c). Only the left half of the inversion is shown for each case; patterns for the right half of the inversion are symmetric to the ones presented.
References
-
- Hoffmann A., Rieseberg L. 2008. Revisiting the impact of inversions in evolution: from population genetic markers to drivers of adaptive shifts and speciation? Annu. Rev. Ecol. Evol. Syst. 39, 21. 10.1146/annurev.ecolsys.39.110707.173532 (doi:10.1146/annurev.ecolsys.39.110707.173532) - DOI - PMC - PubMed
-
- Kirkpatrick M. 2010. How and why chromosome inversions evolve. PLoS Biol. 8, 1000501. 10.1371/journal.pbio.1000501 (doi:10.1371/journal.pbio.1000501) - DOI - PMC - PubMed
-
- Dobzhansky T. 1951. Genetics and the origin of species (eds Eldredge N., Gould S. J.), 3rd edn. New York, NY: Columbia University Press
-
- White M. J. D. 1973. Animal cytology and evolution, 3rd edn. Cambridge, UK: Cambridge University Press
Publication types
MeSH terms
LinkOut - more resources
Full Text Sources