Review
. 2012 Feb 5;367(1587):451-60.
doi: 10.1098/rstb.2011.0260.

Divergence hitchhiking and the spread of genomic isolation during ecological speciation-with-gene-flow

Affiliations
Review

Divergence hitchhiking and the spread of genomic isolation during ecological speciation-with-gene-flow

Sara Via. Philos Trans R Soc Lond B Biol Sci. .

Abstract

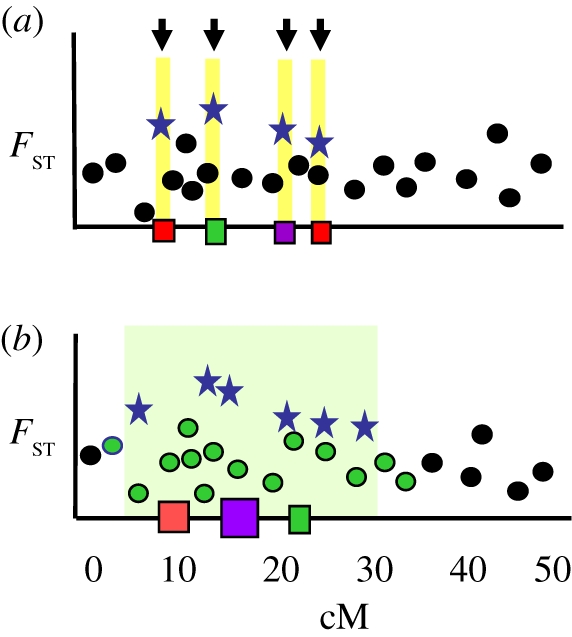
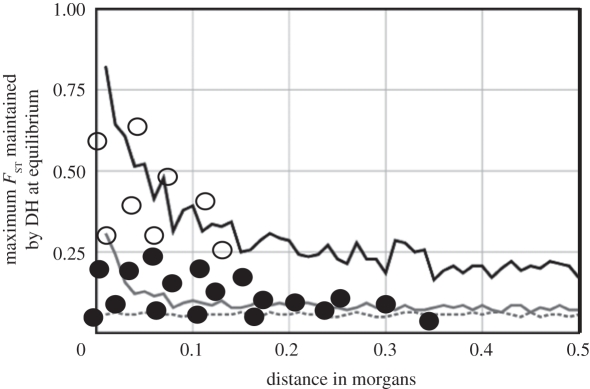
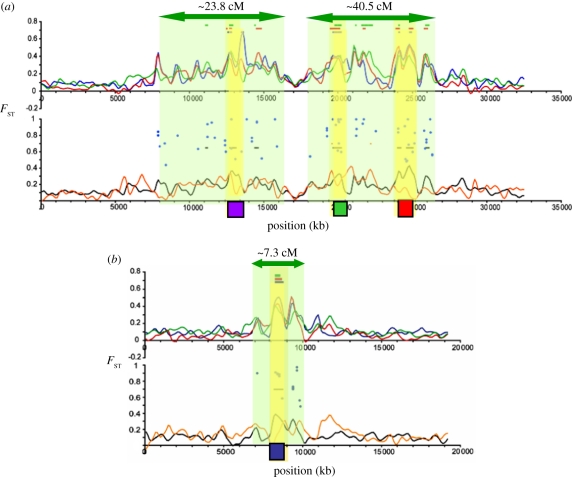
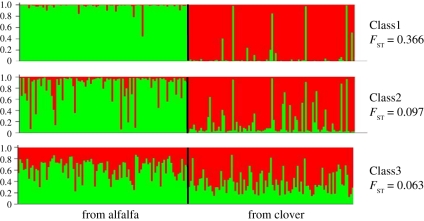
In allopatric populations, geographical separation simultaneously isolates the entire genome, allowing genetic divergence to accumulate virtually anywhere in the genome. In sympatric populations, however, the strong divergent selection required to overcome migration produces a genetic mosaic of divergent and non-divergent genomic regions. In some recent genome scans, each divergent genomic region has been interpreted as an independent incidence of migration/selection balance, such that the reduction of gene exchange is restricted to a few kilobases around each divergently selected gene. I propose an alternative mechanism, 'divergence hitchhiking' (DH), in which divergent selection can reduce gene exchange for several megabases around a gene under strong divergent selection. Not all genes/markers within a DH region are divergently selected, yet the entire region is protected to some degree from gene exchange, permitting genetic divergence from mechanisms other than divergent selection to accumulate secondarily. After contrasting DH and multilocus migration/selection balance (MM/SB), I outline a model in which genomic isolation at a given genomic location is jointly determined by DH and genome-wide effects of the progressive reduction in realized migration, then illustrate DH using data from several pairs of incipient species in the wild.


Figures

Figure 1.
Figure 1.
Alternate interpretations of outliers. (a) In the conventional view, each outlier marks an individual candidate gene under migration/selection balance (arrowed yellow bars). Between candidate gene regions, low FST markers are assumed to experience gene exchange. (b) A region of divergence hitchhiking (DH; green shading) around a cluster of divergently selected QTL is recognized by the associated cluster of FST outliers. Low FST markers within DH regions are assumed to be protected from gene exchange. Red, green and purple squares, QTLs for different traits; blue star, class1; green circle, class2; black circle, class 3.
Figure 2.
Figure 2.
Relationship between the maximum FST that can be maintained by DH at equilibrium and the map distance from a selected gene, for two intensities of divergent selection (modified from [27], for a population with Ne = 1000 and m = 0.001). Hypothetical FST estimates for different markers in a genome scan are overlaid; open circles are FST outliers, filled circles are non-outliers. Although the curves in this figure are often thought to illustrate the predicted FST values under DH, many markers will have lower FST than predicted if the sampled populations are not at equilibrium. This is illustrated here by the mixture of FST outliers and non-outliers near the selected gene. If the selected gene is not at the end of the chromosome, the curves and estimated FST values would be symmetrical around it. Black line, strong local selection; grey line, moderate local selection; dotted line, no local selection.
Figure 3.
Figure 3.
Probable DH regions in threespine stickleback. (a) Genome scan of divergence on LGIV between freshwater and oceanic threespine stickleback (reproduced from figs. 7 & 8 in [53], except for the addition of the QTLs and proposed DH regions). The candidate gene regions are shown as yellow bars; Class1 SNPs appear as blue dots. The purple square marks the location of the gene Eda. Green and red squares mark QTL affecting body shape [54]. Regions of DH (green shading) are arbitrarily extended to the edge of each cluster of SNP outliers. (b) LGVIII from the same study [53]. Blue square denotes a candidate gene at marker stn90; Class1 SNPs appear as blue dots; from [55].
Figure 4.
Figure 4.
Comparative analysis of population structure in the pea aphid host races on alfalfa and clover (STRUCTURE, K = 2). The proportional representation of the two clusters in each of 100 pea aphid genotypes from alfalfa is shown on the left side of each panel; results for aphids collected from red clover are on the right. Marker classes are defined in the text.

Similar articles

Cited by

References

    1. Rice W. R., Hostert E. E. 1993. Laboratory experiments on speciation: what have we learned in 40 years? Evolution 47, 1637–165310.2307/2410209 (doi:10.2307/2410209) - DOI - DOI - PubMed
    1. Via S. 2001. Sympatric speciation in animals: the ugly duckling grows up. Trends Ecol. Evol. 16, 381–39010.1016/S0169-5347(01)02188-7 (doi:10.1016/S0169-5347(01)02188-7) - DOI - DOI - PubMed
    1. Coyne J. A., Orr H. A. 2004. Speciation. Sunderland, MA: Sinauer Associates
    1. Felsenstein J. 1981. Skepticism toward Santa Rosalia, or why are there so few kinds of animals? Evolution 35, 124–13810.2307/2407946 (doi:10.2307/2407946) - DOI - DOI - PubMed
    1. Schluter D. 2001. Ecology and the origin of species. Trends Ecol. Evol. 16, 372–38010.1016/S0169-5347(01)02198-X (doi:10.1016/S0169-5347(01)02198-X) - DOI - DOI - PubMed

Publication types

LinkOut - more resources