

Multiple origins of endosymbiosis within the Enterobacteriaceae (γ-Proteobacteria): convergence of complex phylogenetic approaches
- PMID: 22201529
- PMCID: PMC3271043
- DOI: 10.1186/1741-7007-9-87
Multiple origins of endosymbiosis within the Enterobacteriaceae (γ-Proteobacteria): convergence of complex phylogenetic approaches
Abstract
Background: The bacterial family Enterobacteriaceae gave rise to a variety of symbiotic forms, from the loosely associated commensals, often designated as secondary (S) symbionts, to obligate mutualists, called primary (P) symbionts. Determination of the evolutionary processes behind this phenomenon has long been hampered by the unreliability of phylogenetic reconstructions within this group of bacteria. The main reasons have been the absence of sufficient data, the highly derived nature of the symbiont genomes and lack of appropriate phylogenetic methods. Due to the extremely aberrant nature of their DNA, the symbiotic lineages within Enterobacteriaceae form long branches and tend to cluster as a monophyletic group. This state of phylogenetic uncertainty is now improving with an increasing number of complete bacterial genomes and development of new methods. In this study, we address the monophyly versus polyphyly of enterobacterial symbionts by exploring a multigene matrix within a complex phylogenetic framework.
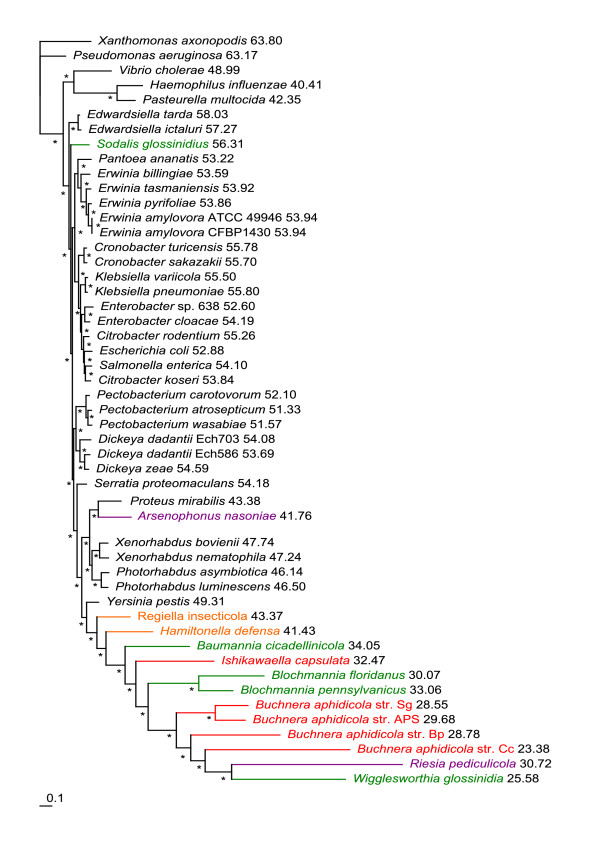
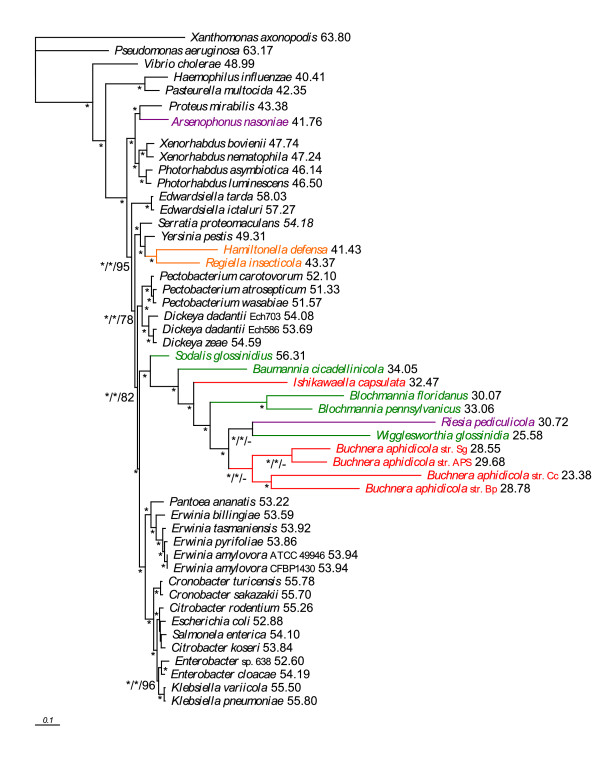
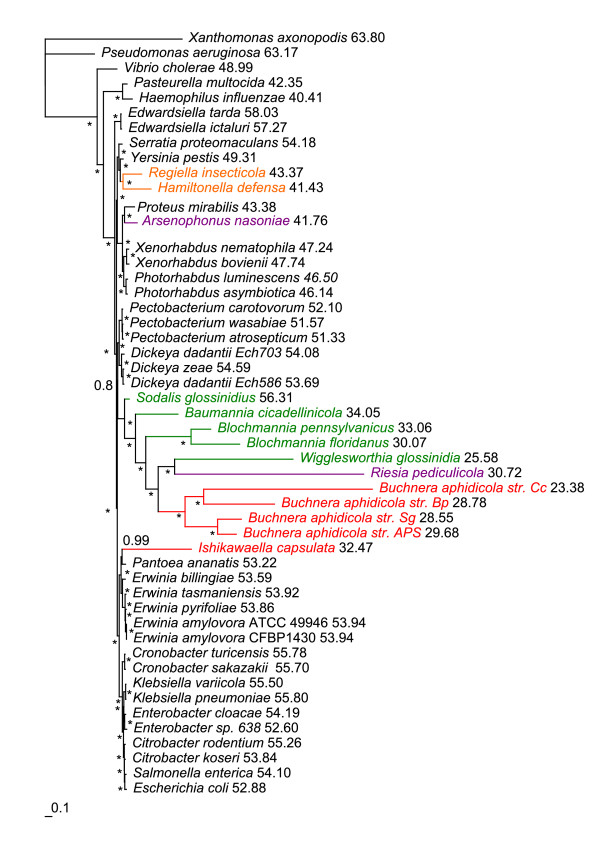
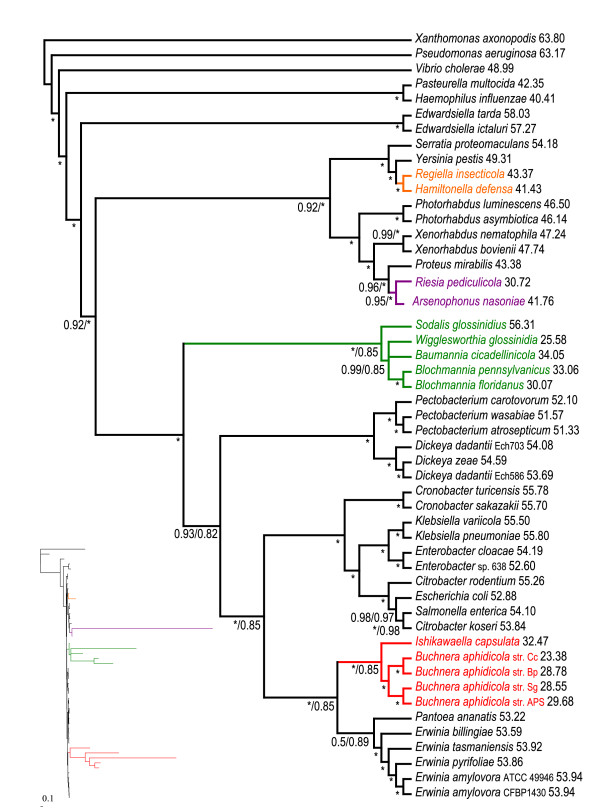
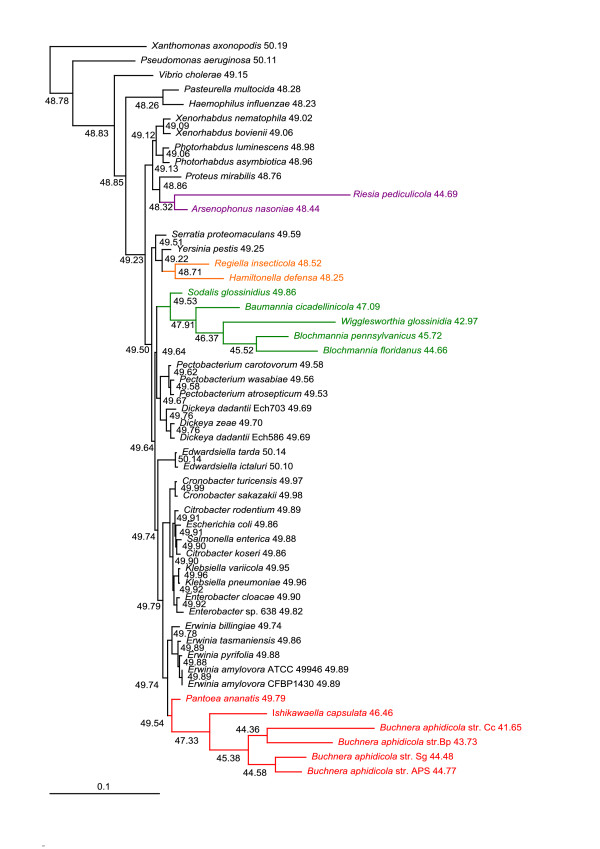
Results: We assembled the richest taxon sampling of Enterobacteriaceae to date (50 taxa, 69 orthologous genes with no missing data) and analyzed both nucleic and amino acid data sets using several probabilistic methods. We particularly focused on the long-branch attraction-reducing methods, such as a nucleotide and amino acid data recoding and exclusion (including our new approach and slow-fast analysis), taxa exclusion and usage of complex evolutionary models, such as nonhomogeneous model and models accounting for site-specific features of protein evolution (CAT and CAT+GTR). Our data strongly suggest independent origins of four symbiotic clusters; the first is formed by Hamiltonella and Regiella (S-symbionts) placed as a sister clade to Yersinia, the second comprises Arsenophonus and Riesia (S- and P-symbionts) as a sister clade to Proteus, the third Sodalis, Baumannia, Blochmannia and Wigglesworthia (S- and P-symbionts) as a sister or paraphyletic clade to the Pectobacterium and Dickeya clade and, finally, Buchnera species and Ishikawaella (P-symbionts) clustering with the Erwinia and Pantoea clade.
Conclusions: The results of this study confirm the efficiency of several artifact-reducing methods and strongly point towards the polyphyly of P-symbionts within Enterobacteriaceae. Interestingly, the model species of symbiotic bacteria research, Buchnera and Wigglesworthia, originated from closely related, but different, ancestors. The possible origins of intracellular symbiotic bacteria from gut-associated or pathogenic bacteria are suggested, as well as the role of facultative secondary symbionts as a source of bacteria that can gradually become obligate maternally transferred symbionts.
Figures

Comment in
-
Difficult phylogenetic questions: more data, maybe; better methods, certainly.BMC Biol. 2011 Dec 29;9:91. doi: 10.1186/1741-7007-9-91. BMC Biol. 2011. PMID: 22206462 Free PMC article.
Similar articles
-
Arsenophonus and Sodalis Symbionts in Louse Flies: an Analogy to the Wigglesworthia and Sodalis System in Tsetse Flies.Appl Environ Microbiol. 2015 Sep;81(18):6189-99. doi: 10.1128/AEM.01487-15. Epub 2015 Jul 6. Appl Environ Microbiol. 2015. PMID: 26150448 Free PMC article.
-
Reductive evolution of bacterial genome in insect gut environment.Genome Biol Evol. 2011;3:702-14. doi: 10.1093/gbe/evr064. Epub 2011 Jul 6. Genome Biol Evol. 2011. PMID: 21737395 Free PMC article.
-
Arsenophonus, an emerging clade of intracellular symbionts with a broad host distribution.BMC Microbiol. 2009 Jul 20;9:143. doi: 10.1186/1471-2180-9-143. BMC Microbiol. 2009. PMID: 19619300 Free PMC article.
-
Winding paths to simplicity: genome evolution in facultative insect symbionts.FEMS Microbiol Rev. 2016 Nov 1;40(6):855-874. doi: 10.1093/femsre/fuw028. FEMS Microbiol Rev. 2016. PMID: 28204477 Free PMC article. Review.
-
Genome evolution in bacterial endosymbionts of insects.Nat Rev Genet. 2002 Nov;3(11):850-61. doi: 10.1038/nrg931. Nat Rev Genet. 2002. PMID: 12415315 Review.
Cited by
-
Capturing the Phylogeny of Holometabola with Mitochondrial Genome Data and Bayesian Site-Heterogeneous Mixture Models.Genome Biol Evol. 2016 May 22;8(5):1411-26. doi: 10.1093/gbe/evw086. Genome Biol Evol. 2016. PMID: 27189999 Free PMC article.
-
Convergent evolution of a labile nutritional symbiosis in ants.ISME J. 2022 Sep;16(9):2114-2122. doi: 10.1038/s41396-022-01256-1. Epub 2022 Jun 14. ISME J. 2022. PMID: 35701539 Free PMC article.
-
Cladogenesis and Genomic Streamlining in Extracellular Endosymbionts of Tropical Stink Bugs.Genome Biol Evol. 2018 Feb 1;10(2):680-693. doi: 10.1093/gbe/evy033. Genome Biol Evol. 2018. PMID: 29420776 Free PMC article.
-
The All-Rounder Sodalis: A New Bacteriome-Associated Endosymbiont of the Lygaeoid Bug Henestaris halophilus (Heteroptera: Henestarinae) and a Critical Examination of Its Evolution.Genome Biol Evol. 2017 Oct 1;9(10):2893-2910. doi: 10.1093/gbe/evx202. Genome Biol Evol. 2017. PMID: 29036401 Free PMC article.
-
A novel intracellular mutualistic bacterium in the invasive ant Cardiocondyla obscurior.ISME J. 2016 Feb;10(2):376-88. doi: 10.1038/ismej.2015.119. Epub 2015 Jul 14. ISME J. 2016. PMID: 26172209 Free PMC article.
References
-
- Gottlieb Y, Ghanim M, Gueguen G, Kontsedalov S, Vavre F, Fleury F, Zchori-Fein E. Inherited intracellular ecosystem: symbiotic bacteria share bacteriocytes in whiteflies. FASEB J. 2008;22(7):2591–2599. - PubMed
-
- Hypša V, Křížek J. Molecular evidence for polyphyletic origin of the primary symbionts of sucking lice (Phthiraptera, Anoplura) Microb Ecol. 2007;54(2):242–251. - PubMed
-
- Caspi-Fluger A, Zchori-Fein E. Do plants and insects share the same symbionts? Isr J Plant Sci. 2010;58(2):113–119.
Publication types
MeSH terms
Substances
LinkOut - more resources
Full Text Sources
Miscellaneous
