Clinical Trial
. 2012 Jan;122(1):359-67.
doi: 10.1172/JCI60202. Epub 2011 Dec 27.

Human adenovirus-specific T cells modulate HIV-specific T cell responses to an Ad5-vectored HIV-1 vaccine

Affiliations
Clinical Trial

Human adenovirus-specific T cells modulate HIV-specific T cell responses to an Ad5-vectored HIV-1 vaccine

Nicole Frahm et al. J Clin Invest. 2012 Jan.

Abstract

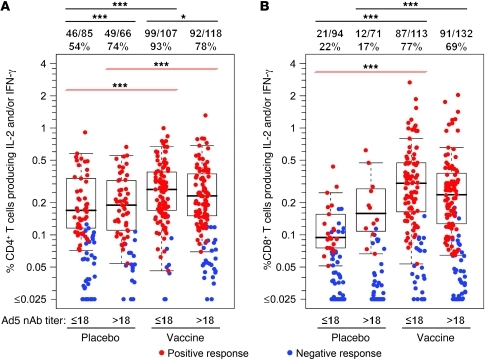
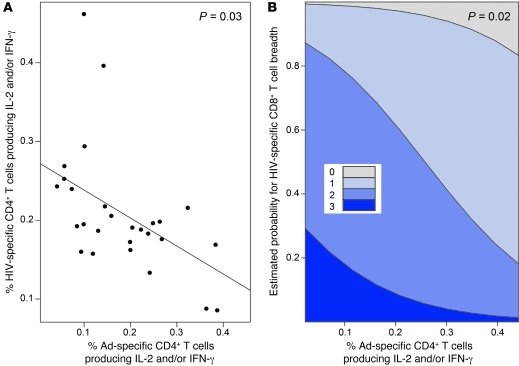
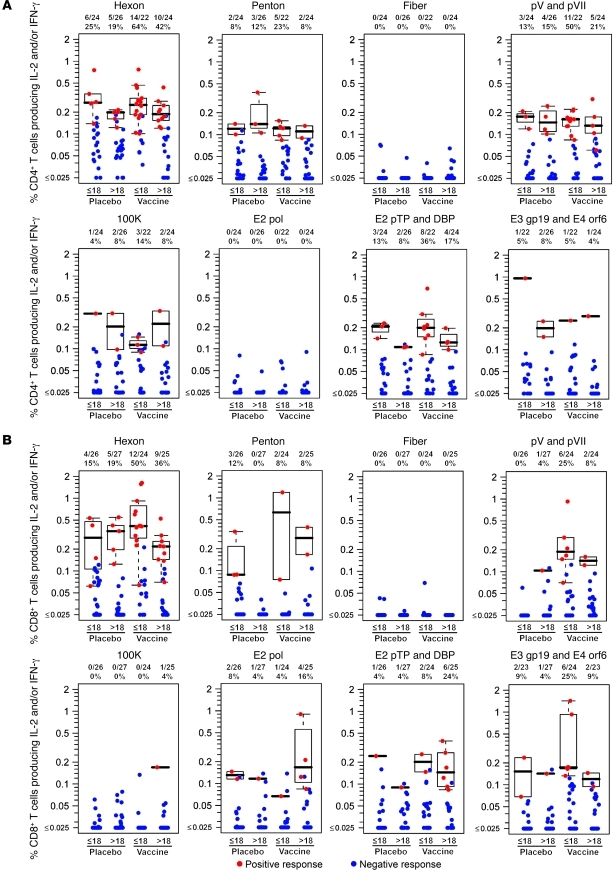
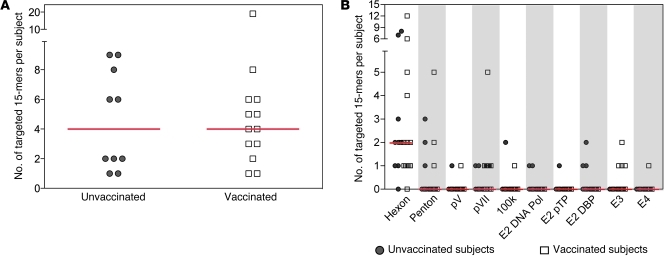
Recombinant viruses hold promise as vectors for vaccines to prevent infectious diseases with significant global health impacts. One of their major limitations is that preexisting anti-vector neutralizing antibodies can reduce T cell responses to the insert antigens; however, the impact of vector-specific cellular immunity on subsequent insert-specific T cell responses has not been assessed in humans. Here, we have identified and compared adenovirus-specific and HIV-specific T cell responses in subjects participating in two HIV-1 vaccine trials using a vaccine vectored by adenovirus serotype 5 (Ad5). Higher frequencies of pre-immunization adenovirus-specific CD4⁺ T cells were associated with substantially decreased magnitude of HIV-specific CD4⁺ T cell responses and decreased breadth of HIV-specific CD8⁺ T cell responses in vaccine recipients, independent of type-specific preexisting Ad5-specific neutralizing antibody titers. Further, epitopes recognized by adenovirus-specific T cells were commonly conserved across many adenovirus serotypes, suggesting that cross-reactivity of preexisting adenovirus-specific T cells can extend to adenovirus vectors derived from rare serotypes. These findings provide what we believe to be a new understanding of how preexisting viral immunity may impact the efficacy of vaccines under current evaluation for prevention of HIV, tuberculosis, and malaria.


Figures

Figure 1
Figure 1. Rates and magnitudes of Ad5 vector-specific T cell responses in 410 Step study participants 4 weeks after final immunization (week 30).
Percentages of T cells producing IFN-γ and/or IL-2 after stimulation with empty Ad5 vector are shown for CD4+ (A) and CD8+ (B) T cells. Red symbols represent positive responses; blue symbols represent responses below the positivity threshold. Box plots represent positive responses only and show medians, interquartile ranges (IQRs), and whiskers extending to the furthest point within 1.5 times the IQR from the upper or lower quartile. Subjects are grouped by treatment (placebo or vaccine) and baseline Ad5 nAb titers (≤18 or >18) as indicated. Numbers above the panels show response rates. Significant differences in response rates are shown by black lines above the figure; significant differences in response magnitudes are shown by red lines (*P = 0.05; ***P < 0.001). Participants with high background cytokine production (>0.1%) by CD4+ T cells were excluded from analysis, resulting in reduced numbers compared with CD8+ T cell responses.
Figure 2
Figure 2. Baseline Ad-specific CD4+ T cell responses are inversely associated with insert-specific T cell responses.
The magnitude of the baseline Ad-specific CD4+ T cell response (defined as %CD4+ T cells producing IFN-γ and/or IL-2 following stimulation with empty Ad5 vector) on the x axis is plotted against (A) the magnitude of the HIV-specific CD4+ T cell response at the memory time point or (B) the estimated probability of having HIV-specific CD8+ T cells recognizing 0, 1, 2, or 3 proteins at the peak time point on the y axes. (A) The solid line is the regression line of the predicted HIV-specific CD4+ T cell response at the memory time point given the magnitude of the baseline Ad-specific CD4+ T cell response. (B) Estimated probabilities are based on a proportional odds model (see Methods). The regression line in A and probability estimates in B have been adjusted for sex, number of vaccinations, and log10 Ad5 nAb titer distributions.
Figure 3
Figure 3. Rates and magnitudes of Ad5 peptide pool–specific T cell responses in Step study participants at 4 weeks (week 30) after final immunization.
(A) Percentage of CD4+ T cells producing IFN-γ and/or IL-2 after stimulation with Ad5 peptide pools in 96 participants. (B) Percentage of CD8+ T cells producing IFN-γ and/or IL-2 after stimulation with Ad5 peptide pools in 102 participants. Red symbols represent positive responses; blue symbols represent responses below the positivity threshold. Box plots represent positive responses only and show medians, IQR, and whiskers extending to the furthest point within 1.5 times the IQR from the upper or lower quartile. Subjects are grouped by treatment (placebo or vaccine) and baseline Ad5 nAb titers (≤18 or >18) as indicated. Numbers above each panel show response rates. Participants with high background cytokine production (>0.1%) by CD4+ T cells were excluded from analysis, resulting in reduced numbers compared with CD8+ T cell responses. The peptide pools are described in Supplemental Table 1. DBP, ssDNA binding protein; pol, polymerase; pTP, preterminal protein.
Figure 4
Figure 4. Breadth and distribution of T cell responses to Ad5 15-mers.
Responses to single Ad5 15-mer peptides were mapped by IFN-γ ELISPOT in 18 HVTN 071 vaccine recipients and 14 unvaccinated HIV-uninfected SACs. Breadth (A) and distribution (B) for each targeted 15-mer are shown for 13 HVTN 071 vaccinees (open squares) and 10 SACs (gray circles) with at least 1 positive response. Red bars represent medians. (A) Total breadth as measured by the number of targeted 15-mers across all tested proteins; two overlapping 15-mers were counted as a single response. (B) Number of targeted 15-mers per Ad5 protein (fiber generated no responses).
Figure 5
Figure 5. Targeted hexon 15-mers are conserved across adenovirus serogroups.
Amino acid alignment is shown for group C adenoviruses (Ad1, Ad2, Ad5, and Ad6), Ad26 (group D), and Ad35 (group B). Light gray represents 15-mer sequences targeted in HVTN 071 vaccine recipients only; dark gray represents 15-mer sequences targeted in unvaccinated SAC subjects only; black represents 15-mer sequences recognized by participants from both cohorts.

Comment in

References

    1. McElrath MJ, et al. HIV-1 vaccine-induced immunity in the test-of-concept Step Study: a case-cohort analysis. Lancet. 2008;372(9653):1894–1905. doi: 10.1016/S0140-6736(08)61592-5. - DOI - PMC - PubMed
    1. Priddy FH, et al. Safety and immunogenicity of a replication-incompetent adenovirus type 5 HIV-1 clade B gag/pol/nef vaccine in healthy adults. Clin Infect Dis. 2008;46(11):1769–1781. doi: 10.1086/587993. - DOI - PubMed
    1. Barouch DH. Novel adenovirus vector-based vaccines for HIV-1. Curr Opin HIV AIDS. 2010;5(5):386–390. doi: 10.1097/COH.0b013e32833cfe4c. - DOI - PMC - PubMed
    1. Smith CA, Woodruff LS, Rooney C, Kitchingman GR. Extensive cross-reactivity of adenovirus-specific cytotoxic T cells. Hum Gene Ther. 1998;9(10):1419–1427. doi: 10.1089/hum.1998.9.10-1419. - DOI - PubMed
    1. Leen AM, et al. Fiber-modified adenoviruses generate subgroup cross-reactive, adenovirus-specific cytotoxic T lymphocytes for therapeutic applications. Blood. 2004;103(3):1011–1019. doi: 10.1182/blood-2003-07-2449. - DOI - PubMed

Publication types

MeSH terms