Review
. 2012 Jan 1;17(2):396-406.
doi: 10.2741/3934.

Profiling of linker histone variants in ovarian cancer

Affiliations
Review

Profiling of linker histone variants in ovarian cancer

Magdalena Medrzycki et al. Front Biosci (Landmark Ed). .

Abstract

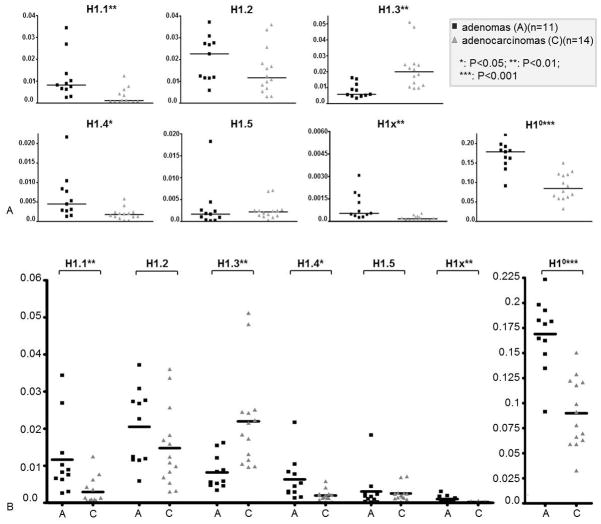
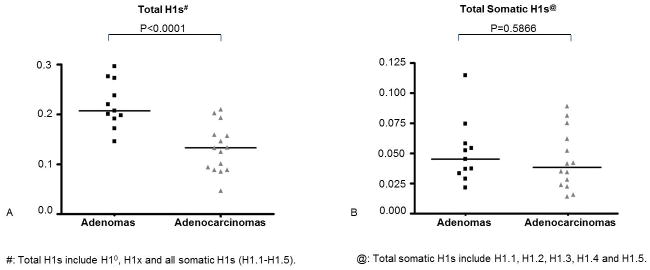
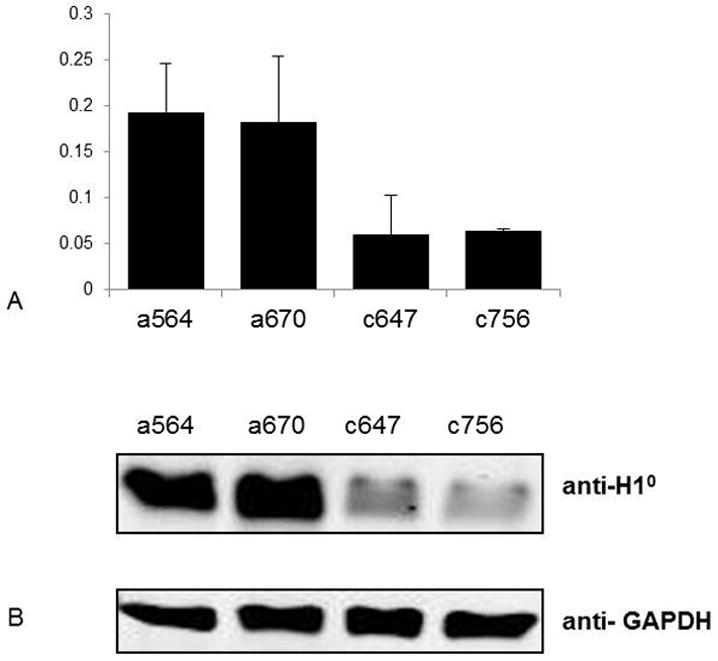
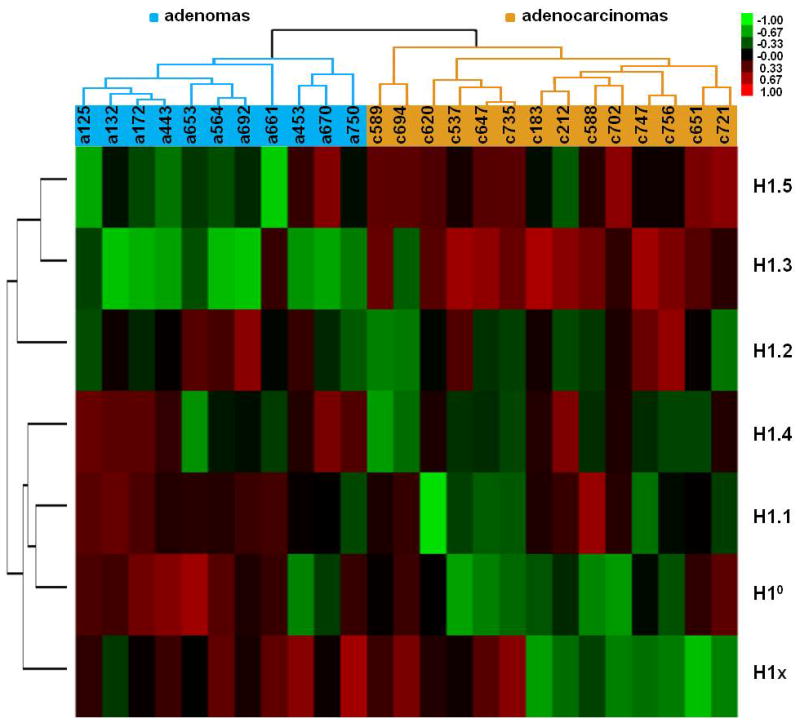
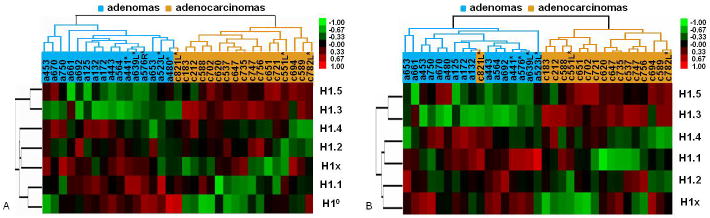
H1 linker histones play a key role in facilitating higher order chromatin folding. Emerging evidence suggests that H1 and its multiple variants are important epigenetic factors in modulating chromatin function and gene expression. Ovarian cancer is a devastating disease, ranking the fifth leading cause of all women cancer death due to its poor prognosis and difficulty in early diagnosis. Although epigenetic alterations in ovarian cancers are being appreciated in general, the role of H1 has not been explored. Here, using quantitative RT-PCR assays, we systematically examined the expression of 7 H1 genes in 33 human epithelial ovarian tumors. Whereas the expression of H1.3 was markedly increased, the expression of H10, H1.1, H1.4 and H1x were significantly reduced in malignant adenocarcinomas compared with benign adenomas. Strikingly, ovarian adenocarcinomas and adenomas exhibited characteristic expression patterns, and expression profiling of 7 H1 genes in tumor samples discriminated adenocarcinomas vs. adenomas with high accuracy. These findings indicate that the expression of H1 variants is exquisitely regulated and may serve as potential epigenetic biomarkers for ovarian cancer.


Figures

Figure 1
Figure 1
qRT-PCR analysis of mRNA levels of linker histone variants in ovarian tumors. Normalized mRNA expression levels of H1 subtypes are presented individually (A) and as a group (B). Y axis represents relative expression units. Each dot represents average expression values obtained from three independent measurements from one tumor sample. Data were normalized with the expression level of GAPDH and primer efficiency factor. *: P<0.05; **: P<0.01; ***: P<0.001.
Figure 2
Figure 2
Quantification of mRNA levels of total H1s and total somatic H1s. (A) Total relative expression units for all H1s; (B) Total relative expression units for all somatic H1s (H1.1-H1.5). Y axis represents relative expression units. Each dot represents the averagevalue of the relative expression units obtained from three independent measurements of one tumor sample. Data were normalized with expression of GAPDH and primer efficiency factor. *: P<0.05; **: P<0.01; ***: P<0.001.
Figure 3
Figure 3
Reduced H1° expression in ovarian adenocarcinomas. (A) qRT-PCR analysis of H1° mRNA messages. Y axis: relative expression units of H1°. Expression values were normalized by the expression level of GAPDH. (B) Western blot analysis of H1° protein levels. GAPDH served as a loading control.
Figure 4
Figure 4
Hierarchical clustering diagram of differential expression data of 7 H1 subtypes in ovarian adenomas and adenocarcinomas. Red, green or black colors represent higher, lower, or no change in relative expression compared with the median expression level across all tumor samples, respectively. The dendrograms at the top and on the left show the clusters defined by similarities in expression patterns across the samples and genes. All adenocarcinoma samples cluster separately from adenomas.
Figure 5
Figure 5
Validation of discriminating expression patterns of H1 subtypes in ovarian adenomas and adenocarcinomas. Hierarchical clustering diagrams of expression profile of all 7 H1 genes (A), or leaving out H1° (B), of all 33 samples are shown. Samples include 8 blind test samples (marked with *) and 25 tumors of the initial batch. Both (A) and (B) show correct segregation of all but one (c821L) samples into ovarian adenomas vs. adenocarcinomas.

References

    1. Jemal A, Siegel R, Ward E, Hao Y, Xu J, Murray T, Thun MJ. Cancer statistics, 2008. CA Cancer J Clin. 2008;58:71–96. - PubMed
    1. 2010 http://documents.cancer.org/acs/groups/cid/documents/webcontent/003130-p....
    1. Balch C, Fang F, Matei DE, Huang TH, Nephew KP. Minireview: epigenetic changes in ovarian cancer. Endocrinology. 2009;150:4003–11. - PMC - PubMed
    1. Widschwendter M, Jiang G, Woods C, Muller HM, Fiegl H, Goebel G, Marth C, Muller-Holzner E, Zeimet AG, Laird PW, Ehrlich M. DNA hypomethylation and ovarian cancer biology. Cancer Res. 2004;64:4472–80. - PubMed
    1. Kwon MJ, Kim SS, Choi YL, Jung HS, Balch C, Kim SH, Song YS, Marquez VE, Nephew KP, Shin YK. Derepression of CLDN3 and CLDN4 during ovarian tumorigenesis is associated with loss of repressive histone modifications. Carcinogenesis. 2010;31:974–83. - PMC - PubMed

Publication types

MeSH terms