

In vivo quantification of tumor receptor binding potential with dual-reporter molecular imaging
- PMID: 22203241
- PMCID: PMC3526808
- DOI: 10.1007/s11307-011-0534-y
In vivo quantification of tumor receptor binding potential with dual-reporter molecular imaging
Abstract
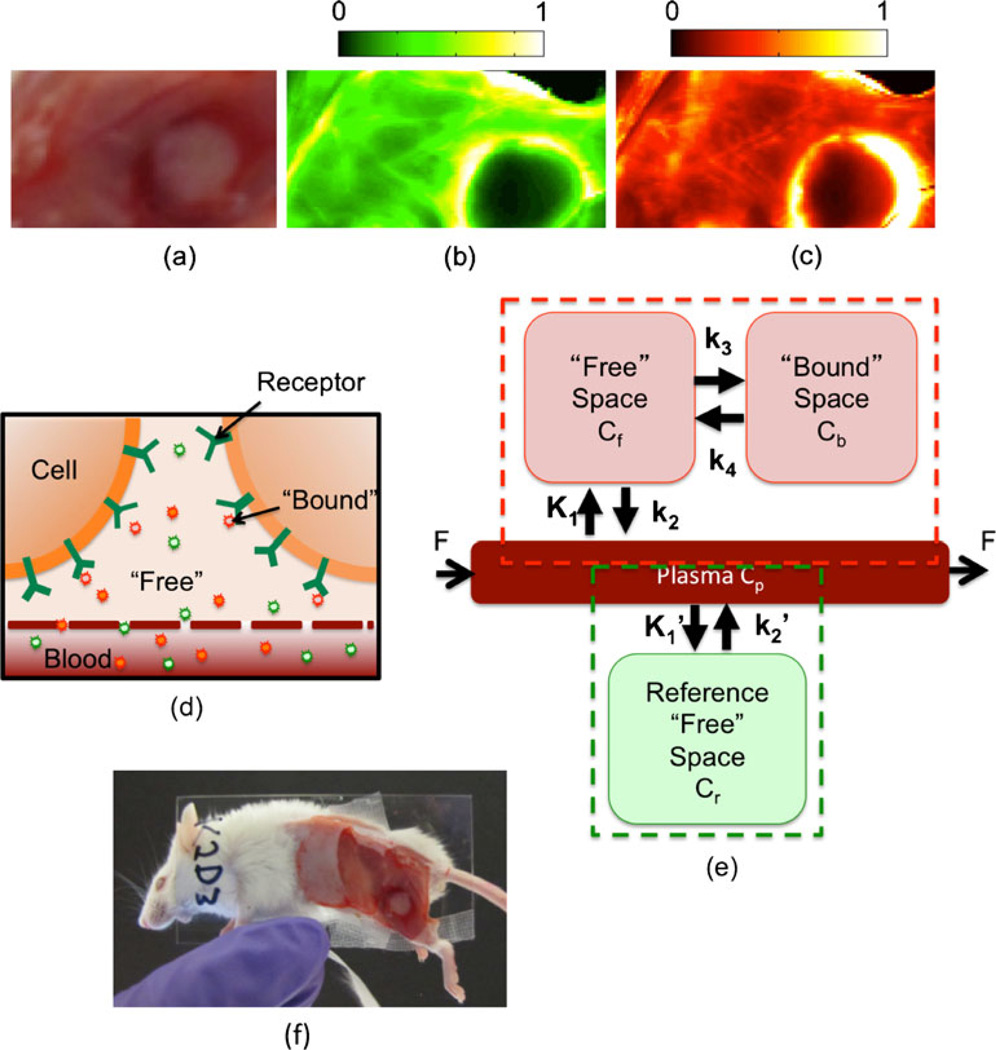
Purpose: Receptor availability represents a key component of current cancer management. However, no approaches have been adopted to do this clinically, and the current standard of care is invasive tissue biopsy. A dual-reporter methodology capable of quantifying available receptor binding potential of tumors in vivo within a clinically relevant time scale is presented.
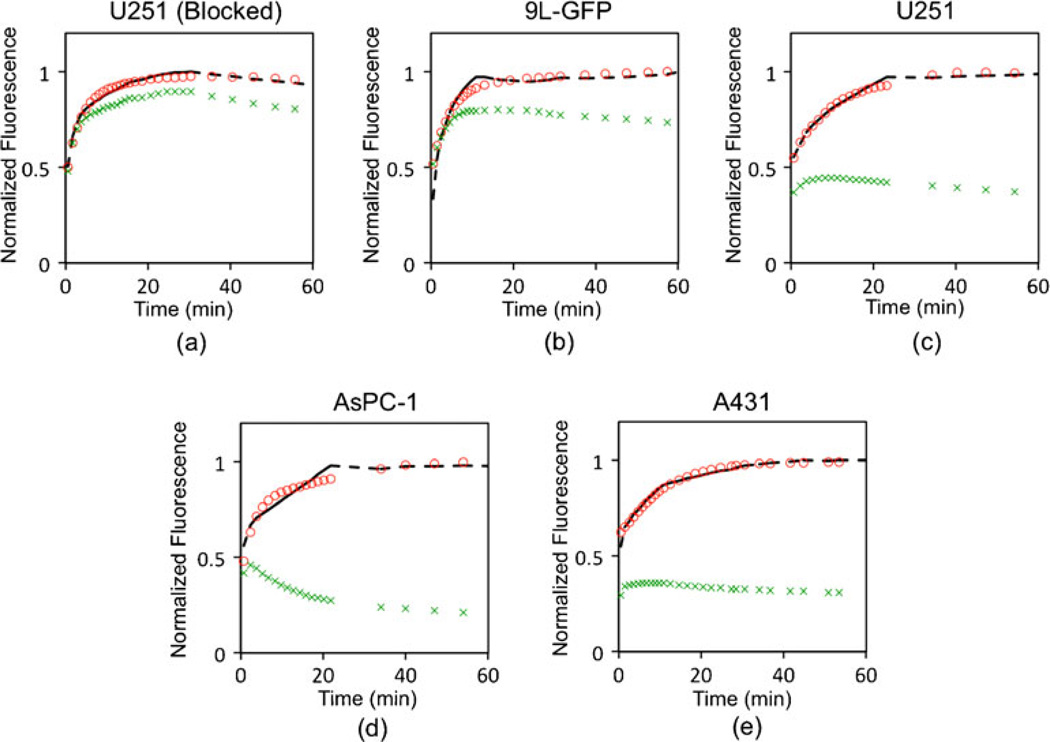
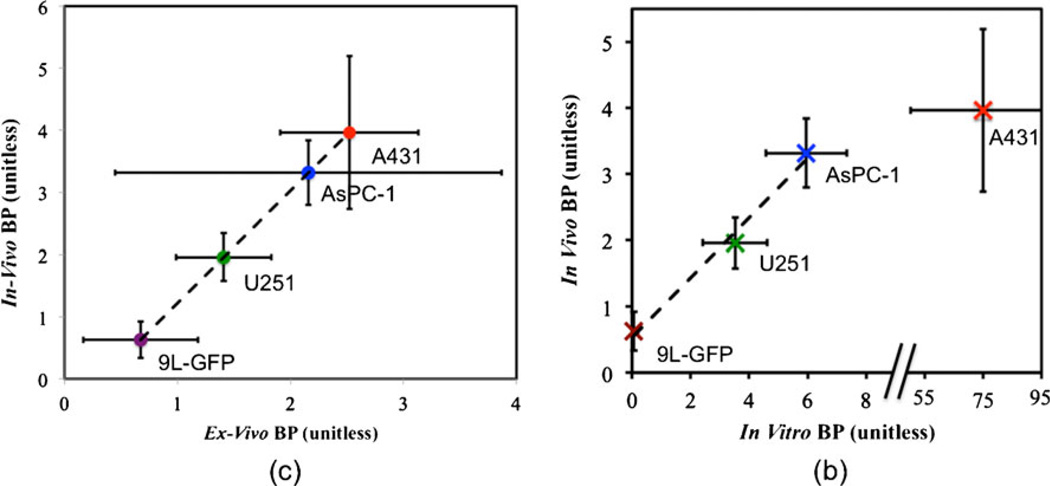
Procedures: To test the methodology, a fluorescence imaging-based adaptation was validated against ex vivo and in vitro measures of epidermal growth factor receptor (EGFR) binding potential in four tumor lines in mice, each line expected to express a different level of EGFR.
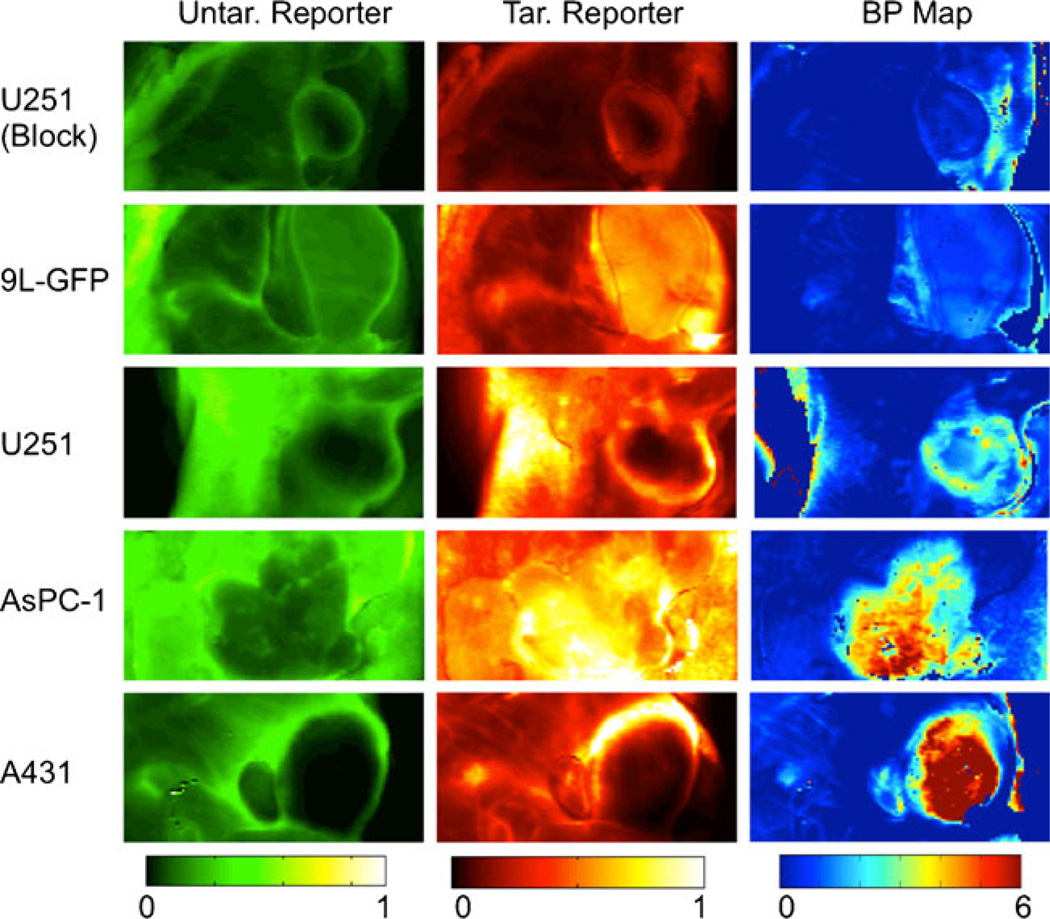
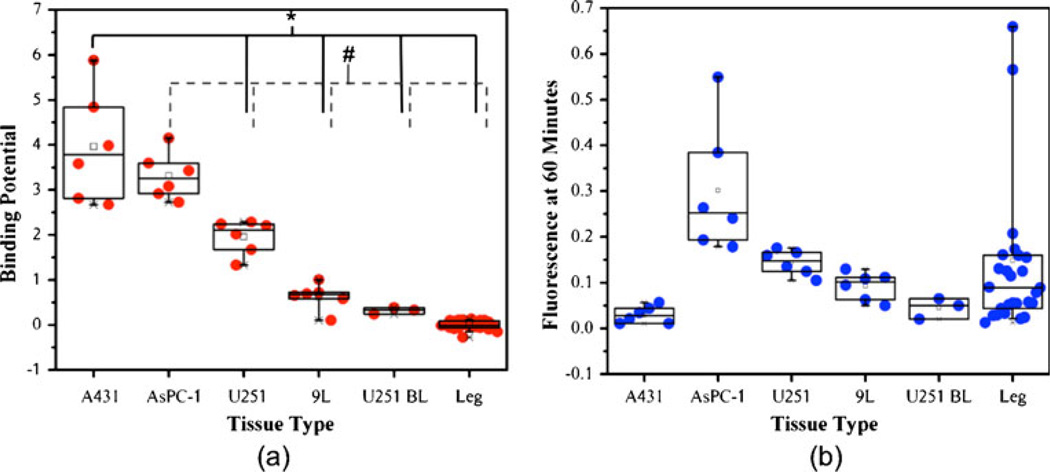
Results: A strong correlation was observed between in vivo and ex vivo measures of binding potential for all tumor lines (r = 0.99, p < 0.01, slope = 1.80 ± 0.48, and intercept = -0.58 ± 0.84) and between in vivo and in vitro for the three lines expressing the least amount of EGFR (r = 0.99, p < 0.01, slope = 0.64 ± 0.32, and intercept = 0.47 ± 0.51).
Conclusions: By providing a fast and robust measure of receptor density in tumors, the presented methodology has powerful implications for improving choices in cancer intervention, evaluation, and monitoring, and can be scaled to the clinic with an imaging modality like SPECT.
Conflict of interest statement
Figures
Similar articles
-
Molecular imaging of epidermal growth factor receptor kinase activity.Anal Biochem. 2011 Oct 1;417(1):57-64. doi: 10.1016/j.ab.2011.05.040. Epub 2011 May 30. Anal Biochem. 2011. PMID: 21693098 Free PMC article.
-
Noninvasive quantification of target availability during therapy using paired-agent fluorescence tomography.Theranostics. 2020 Sep 14;10(24):11230-11243. doi: 10.7150/thno.45273. eCollection 2020. Theranostics. 2020. PMID: 33042280 Free PMC article.
-
In-vivo imaging of oral squamous cell carcinoma by EGFR monoclonal antibody conjugated near-infrared quantum dots in mice.Int J Nanomedicine. 2011;6:1739-45. doi: 10.2147/IJN.S23348. Epub 2011 Aug 19. Int J Nanomedicine. 2011. PMID: 21980236 Free PMC article.
-
Identification of Disease States and Response to Therapy in Humans by Utilizing the Biomarker EGFR for Targeted Molecular Imaging.Curr Protein Pept Sci. 2016;17(6):534-42. doi: 10.2174/1389203717666160101123610. Curr Protein Pept Sci. 2016. PMID: 26721405 Review.
-
Analysis of Progress and Challenges of EGFR-Targeted Molecular Imaging in Cancer With a Focus on Affibody Molecules.Mol Imaging. 2019 Jan-Dec;18:1536012118823473. doi: 10.1177/1536012118823473. Mol Imaging. 2019. PMID: 30799684 Free PMC article. Review.
Cited by
-
Generalized paired-agent kinetic model for in vivo quantification of cancer cell-surface receptors under receptor saturation conditions.Phys Med Biol. 2017 Jan 21;62(2):394-414. doi: 10.1088/1361-6560/62/2/394. Epub 2016 Dec 20. Phys Med Biol. 2017. PMID: 27997381 Free PMC article.
-
Preclinical PET imaging of EGFR levels: pairing a targeting with a non-targeting Sel-tagged Affibody-based tracer to estimate the specific uptake.EJNMMI Res. 2016 Dec;6(1):58. doi: 10.1186/s13550-016-0213-8. Epub 2016 Jul 7. EJNMMI Res. 2016. PMID: 27388754 Free PMC article.
-
Simultaneous In Vivo Fluorescent Markers for Perfusion, Protoporphyrin Metabolism, and EGFR Expression for Optically Guided Identification of Orthotopic Glioma.Clin Cancer Res. 2017 May 1;23(9):2203-2212. doi: 10.1158/1078-0432.CCR-16-1400. Epub 2016 Oct 31. Clin Cancer Res. 2017. PMID: 27799250 Free PMC article.
-
Accounting for pharmacokinetic differences in dual-tracer receptor density imaging.Phys Med Biol. 2014 May 21;59(10):2341-51. doi: 10.1088/0031-9155/59/10/2341. Epub 2014 Apr 17. Phys Med Biol. 2014. PMID: 24743262 Free PMC article.
-
Quantitative in vivo immunohistochemistry of epidermal growth factor receptor using a receptor concentration imaging approach.Cancer Res. 2014 Dec 15;74(24):7465-74. doi: 10.1158/0008-5472.CAN-14-0141. Epub 2014 Oct 24. Cancer Res. 2014. PMID: 25344226 Free PMC article.
References
-
- Peer D, Karp JM, Hong S, Farokhzad OC, Margalit R, Langer R. Nanocarriers as an emerging platform for cancer therapy. Nat Nanotechnol. 2007;2:751–760. - PubMed
-
- Ntziachristos V, Tung CH, Bremer C, Weissleder R. Fluorescence molecular tomography resolves protease activity in vivo. Nat Med. 2002;8:757–760. - PubMed
-
- Weissleder R, Tung CH, Mahmood U, Bogdanov A., Jr In vivo imaging of tumors with protease-activated near-infrared fluorescent probes. Nat Biotechnol. 1999;17:375–378. - PubMed
Publication types
MeSH terms
Substances
Grants and funding
LinkOut - more resources
Full Text Sources
Other Literature Sources
Research Materials
Miscellaneous
