. 2011 Dec 16:5:101.
doi: 10.3389/fnsys.2011.00101. eCollection 2011.

Prey capture behavior evoked by simple visual stimuli in larval zebrafish

Affiliations

Prey capture behavior evoked by simple visual stimuli in larval zebrafish

Isaac H Bianco et al. Front Syst Neurosci. .

Abstract

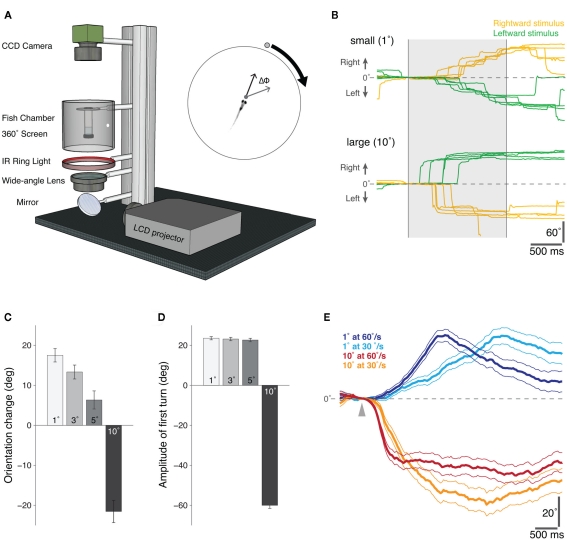
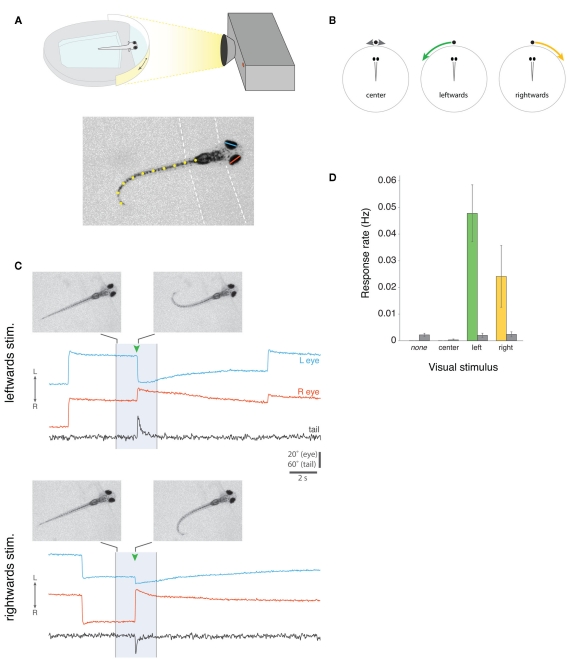
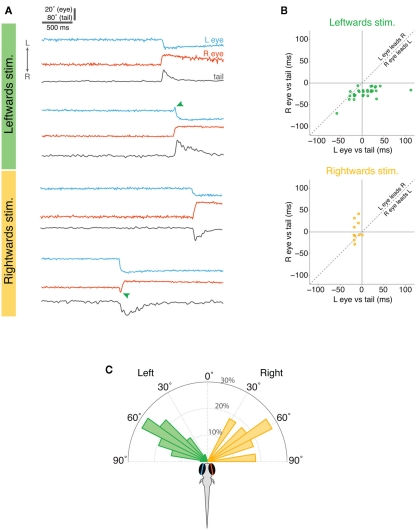
Understanding how the nervous system recognizes salient stimuli in the environment and selects and executes the appropriate behavioral responses is a fundamental question in systems neuroscience. To facilitate the neuroethological study of visually guided behavior in larval zebrafish, we developed "virtual reality" assays in which precisely controlled visual cues can be presented to larvae whilst their behavior is automatically monitored using machine vision algorithms. Freely swimming larvae responded to moving stimuli in a size-dependent manner: they directed multiple low amplitude orienting turns (∼20°) toward small moving spots (1°) but reacted to larger spots (10°) with high-amplitude aversive turns (∼60°). The tracking of small spots led us to examine how larvae respond to prey during hunting routines. By analyzing movie sequences of larvae hunting paramecia, we discovered that all prey capture routines commence with eye convergence and larvae maintain their eyes in a highly converged position for the duration of the prey-tracking and capture swim phases. We adapted our virtual reality assay to deliver artificial visual cues to partially restrained larvae and found that small moving spots evoked convergent eye movements and J-turns of the tail, which are defining features of natural hunting. We propose that eye convergence represents the engagement of a predatory mode of behavior in larval fish and serves to increase the region of binocular visual space to enable stereoscopic targeting of prey.

Keywords: behavior; binocular vision; ocular vergence; prey capture; zebrafish.


Figures

Figure 1
Figure 1
Behavioral responses of freely swimming zebrafish to moving visual stimuli presented in a “Virtual World.” (A) Schematic diagram of the “virtual visual world” assay for freely swimming larval zebrafish. An LCD projector presents the computer-generated stimulus, via a wide-angle lens, onto a 360° screen. The fish is suspended within a transparent chamber held at the center of the screen and illuminated with an infrared ring-light from below. An infrared-sensitive CCD camera continuously tracks the position and orientation of the swimming zebrafish in real-time (40 Hz). At the start of each trial, the visual stimulus – a moving circular spot of varying size and speed – was positioned directly in front of the fish and then moved 90° to either the left or right, whilst the change in orientation of the fish (ΔΦ) was recorded in real-time (inset). (B) Example orientation trajectories for fish presented with rightward (yellow) and leftward (green) moving small (top: 1° diameter, 60°/s) and large (bottom: 10° diameter, 60°/s) visual stimuli. The shaded region indicates the period of stimulus presentation. Positive angles indicate a rightward change in the orientation of the larva, and negative angles a leftward change. (C) The mean change in orientation during the presentation of moving spots of different sizes, error bars report s.e.m. (1°, n = 705; 3°, n = 690; 5°, n = 646; 10°, n = 615). Positive orientation changes are in the direction of stimulus motion. (D) The mean amplitude of the first directed turn, i.e., directed toward the attractive stimuli (1°, 3°, and 5° diameter spots) and directed away from the repulsive stimulus (10° diameter spot), error bars report s.e.m. (1°, n = 366; 3°, n = 343; 5°, n = 327; 10°, n = 330). (E) The difference between the average orientation trajectories for stimuli moving leftward versus rightward are shown for an attractive (1°) and repulsive (10°) spot moving at two different speeds (fast, 60°/s and slow, 30°/s). The arrowhead marks the time at which the stimulus appears. The different time-courses of the response trajectories for the small (attractive) stimuli of different speeds suggests a visual tracking behavior, possibly related to the tracking phase of natural prey capture; error lines report s.e.m. (1° at 60°/s, n = 705; 1° at 30°/s, n = 561; 10° at 60°/s, n = 615; 10° at 30°/s, n = 479).
Figure 2
Figure 2
Zebrafish larvae respond to paramecia with eye convergence during hunting. (A) Individual frames from a movie sequence of a typical hunting episode showing the 4 stages at which we quantified eye position. The paramecium is indicated by an orange arrowhead. In this case, a J-turn occurs concurrently with eye convergence when the larva first responds to the paramecium. (B) Eye vergence angle (mean ± s.e.m.) at four stages in the hunting routine. (C) Change in right and left eye positions from the start of the hunting episode (green symbols) to the pre-capture frame (brown symbols). Note that nasal rotations correspond to a numerical increase in left eye position and a numerical decrease in right eye position. (D) Change in eye position (start → pre-capture) versus starting eye position for the left (blue) and right (red) eyes. Note that right eye positions were inverted (multiplied by −1) in this plot to aid comparison between the eyes. (E) Cumulative tail angle at the peak of the first J-bend in 62 trials (33 right (yellow) and 29 left (green) J-bends) where larvae first responded to the paramecium with a J-turn in addition to eye convergence. Cumulative angle is plotted as 8 values from the anterior to posterior end of the tail. Thick lines with symbols show mean tail angle profiles. (F) Schematics showing model tails reconstructed from the mean tail angle profiles in (B). The eyes are also depicted at the mean vergence angle 62.5 ms after larvae respond to their prey. (G) Distribution of distances between the center of the fish’s head and the paramecium when the larva first responds to prey. (H) Distribution of angular locations of the paramecia, measured from the extended midsaggital axis of the fish, when the larva first responds to prey. Left panel shows data for all responses and center and right panels show data segregated according to whether the first orienting response included a J-turn or not.
Figure 3
Figure 3
Prey capture assay for partially restrained larval zebrafish. (A) Top, Schematic of the set-up for presenting visual cues to larvae that are partially restrained, but free to move both their eyes and tail. Visual stimuli are projected onto a semicircular diffusive screen in front of the fish and eye and tail movements are recorded from above with a high-speed camera, under infrared illumination (not shown). Bottom, Example camera frame showing automated machine vision tracking of left (blue) and right (red) horizontal eye position, and tail morphology (defined by 10 x-y co-ordinates, shown in yellow). Dashed lines indicate the boundaries of the agarose. (B) Schematic of three visual stimuli, which we presented to larval fish. Small white spots either oscillated back and forth directly in front of the larva for 5 s (“center”), or appeared directly in front of the fish and moved ∼90° to the left (“leftward”) or right (“rightward”) in 3 s. (C) Examples of two complete 20 s trials from the same larva, presented with a leftward-moving spot (top) or rightward-moving spot (bottom). The 3 s visual stimulus presentation is indicated by the shaded region. At the times indicated by green arrowheads, the larva responded with nasally directed rotations of both eyes (i.e., convergence eye movements) and unilateral tail bending toward the direction of visual stimulus motion. Images show single video frames at the onset of stimulus presentation and at the peak of the first J-bend of the tail. Notice that larvae also perform spontaneous conjugate saccades, which are visible in these traces in the periods surrounding stimulus presentation, and that the eyes are rotated leftward in advance of the larva responding to the leftward-moving spot and rightward in advance of the response to the rightward-moving spot. Note that data traces have been reflected about the x-axis for presentation, such that eye convergence is represented by a decrease in the distance between the left and right eye position traces (see Methods). (D) Frequency of eye convergence responses for different visual stimuli (mean ± s.e.m., n = 21 fish). Colored bars indicate responses during the 3 s stimulus presentation, gray bars indicate spontaneous responses that occurred in the remaining portions of the 20 s trial when no stimulus was shown (for “none” trials, no stimulus was shown during the entire 20 s trial).
Figure 4
Figure 4
Quantification of eye and tail responses. (A) Eye vergence angle before and after convergence responses to leftward (green) and rightward (yellow) moving stimuli. Thick gray bar shows mean vergence angles which are also depicted in the schematics. (B) Change in eye position during eye convergence plotted against initial eye position for the left (blue) and right (red) eyes for trials with leftward (top) and rightward (bottom) moving spots. (C) Initial eye position, before visual stimulus presentation, for trials in which the fish responded to the stimulus versus trials in which there was no response. Data shown as mean ± s.e.m. and mean eye positions are depicted in schematics below the plots. (D) Mean cumulative angle of the tail measured in a 1.2 s time window surrounding spontaneous and stimulus-evoked eye convergence responses. Circles indicate average values across all responses (mean ± s.e.m.). (E) Tail responses associated with eye convergence for leftward (green) and rightward (yellow) moving spot trials. Total cumulative tail angle is plotted against time and traces are aligned to the peak of the first tail bend, indicated by the vertical gray line. Two examples have been colored dark gray to highlight the multiple unilateral tail bends (indicated by small circles), which characterize the responses. (F) Cumulative tail angle along the length of the tail (anterior → posterior) at the peak of the first J-bend (time marked by vertical gray line in (E)). Thick lines with symbols show mean profiles. (G) Schematics showing model tails reconstructed from the mean tail angle profiles in (F). The eyes are shown at the mean vergence angle following the eye convergence response.
Figure 5
Figure 5
Timing of eye and tail responses in restrained larvae. (A) Examples of eye and tail records during the 3 s visual stimulus presentation for two trials with leftward-moving spots (top) and two with rightward-moving spots (bottom). The lower example for each stimulus type shows instances when the eyes initially moved conjugately in the direction of stimulus motion but one eye quickly reversed direction (marked with green arrowheads) such that eye convergence was produced. (B) Relative timing of eye and tail movements. The onset of left eye motion and right eye motion are plotted with respect to the onset of tail motion (time zero), with negative values indicating that the eye moves before the tail. Overlapping points have been slightly displaced for clarity. (C) Angular distribution of the visual stimuli at the time the larvae responded.
Figure 6
Figure 6
Larval zebrafish engage a binocular viewing mode when they commence hunting. (A) Scale drawing showing predicted changes in the binocular visual field of larval zebrafish as a consequence of eye convergence. The separation between the optical centers of the left and right eyes was taken as 458 μm and the functional retinal field as 163° after Easter and Nicola (1996). Before freely swimming larvae responded to paramecia, mean vergence angle was 36°. Consequently, visual space >1.37 mm from the mid-point of the eyes should fall within the region of binocular overlap (green). This region represents 12% of the total field of view. Just prior to the capture swim, mean vergence angle was 76.4°, advancing the binocular visual field to only 401 μm in front of the mid-point of the eyes and expanding the binocular proportion of visual space to 36%. The orange star indicates the mean distance of paramecia when larvae commence their capture swim (McElligott and O’Malley, 2005). (B) Schematic depicting the sequence of prey capture related responses of a restrained larval zebrafish presented with small moving visual spots. (1) In our assay, spots appeared directly in front of the larvae and then swept to the left or right. In trials where larvae responded to the visual stimulus, both eyes were, on average, oriented in the direction of stimulus motion (rightward in this example) prior to the onset of stimulus presentation. (2) Larvae start to respond to the moving spots after ∼1.9 s, when the spots reach approximately 60° from their extended midsaggital plane. Nasally directed rotation of the left eye is the first element of the behavioral response to rightward-moving spots. (3) Movement of the right eye and the tail commence approximately 20 ms later. The right eye might initially move in a temporal direction, “tracking” the motion of the spot. (4) The right eye reverses direction such that the eyes converge.

References

    1. Beck J. C., Gilland E., Tank D. W., Baker R. (2004). Quantifying the ontogeny of optokinetic and vestibuloocular behaviors in zebrafish, medaka, and goldfish. J. Neurophysiol. 92, 3546–356110.1152/jn.00311.2004 - DOI - PubMed
    1. Borla M. A., Palecek B., Budick S., O’Malley D. M. (2002). Prey capture by larval zebrafish: evidence for fine axial motor control. Brain Behav. Evol. 60, 207–22910.1159/000066699 - DOI - PubMed
    1. Brainard D. H. (1997). The psychophysics toolbox. Spat. Vis. 10, 433–43610.1163/156856897X00357 - DOI - PubMed
    1. Burgess H. A., Granato M. (2007). Sensorimotor gating in larval zebrafish. J. Neurosci. 27, 4984–499410.1523/JNEUROSCI.0615-07.2007 - DOI - PMC - PubMed
    1. Burgess H. A., Schoch H., Granato M. (2010). Distinct retinal pathways drive spatial orientation behaviors in zebrafish navigation. Curr. Biol. 20, 381–38610.1016/j.cub.2010.01.022 - DOI - PMC - PubMed