. 2012 Jan 17;109(3):911-6.
doi: 10.1073/pnas.1118910109. Epub 2011 Dec 27.

Mechanical compression drives cancer cells toward invasive phenotype

Affiliations

Mechanical compression drives cancer cells toward invasive phenotype

Janet M Tse et al. Proc Natl Acad Sci U S A. .

Abstract

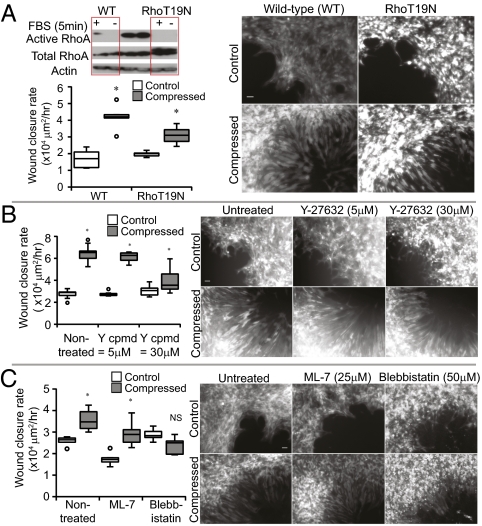
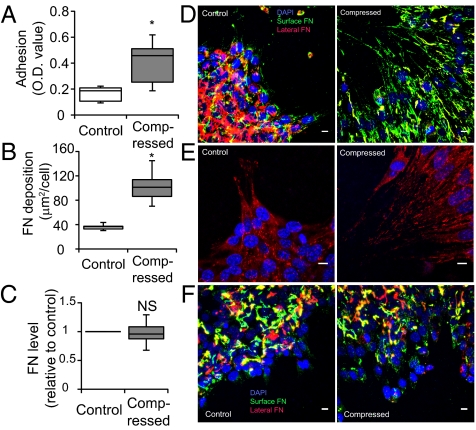
Uncontrolled growth in a confined space generates mechanical compressive stress within tumors, but little is known about how such stress affects tumor cell behavior. Here we show that compressive stress stimulates migration of mammary carcinoma cells. The enhanced migration is accomplished by a subset of "leader cells" that extend filopodia at the leading edge of the cell sheet. Formation of these leader cells is dependent on cell microorganization and is enhanced by compressive stress. Accompanied by fibronectin deposition and stronger cell-matrix adhesion, the transition to leader-cell phenotype results in stabilization of persistent actomyosin-independent cell extensions and coordinated migration. Our results suggest that compressive stress accumulated during tumor growth can enable coordinated migration of cancer cells by stimulating formation of leader cells and enhancing cell-substrate adhesion. This novel mechanism represents a potential target for the prevention of cancer cell migration and invasion.


Conflict of interest statement

The authors declare no conflict of interest.

Figures

Fig. 1.
Fig. 1.
Compression induces migration of mammary carcinoma cells and alters cytoskeletal organization. (A) Cell migration in the scratch-wound assay for five different mammary epithelial cells of increasing invasion potential, either stress-free (control) or subjected to a compressive stress of 5.8 mmHg for 16 h (n = 9; *P < 0.05 compared with corresponding control). (B) MCF10A (Upper) and 67NR cells (Lower) closing the “wound” after 16 h. The compressed 67NR cells at the leading edge exhibited directional alignment and faster migration, whereas compressed MCF10A cells displayed suppressed migration. (Scale bar, 200 μm.) (C) Cytoskeletal staining (phalloidin for actin filaments and tubulin for microtubules) of MCF10A and 67NR cells at the periphery of the cell-denuded area. The 67NR, but not MCF10A, cells demonstrated elongated actin filaments perpendicular to the cell-denuded area and microtubule rearrangement in response to stress. (Scale bar, 10 μm.)
Fig. 2.
Fig. 2.
Compression promotes formation of leader cells at the scratch-wound periphery. (A) Cell orientation at the wound periphery. For the calculated cell alignment correlation index, a value of 1 indicates that the cells align perpendicular to the cell-denuded areas, and a value of 0 indicates orientation parallel to the wound periphery. Random cell alignment would result in an index of 0.63 according to theory. Uncompressed (control) samples had randomly oriented cells, but compression resulted in directed elongation into the denuded region (n = 7). (B) The fraction of cells around the denuded periphery phenotypically identified as leader cells was dramatically higher in the compressed samples. Leader cells were defined as those cells at the wound margin that extend protrusions into the denuded area (n = 12; *P < 0.005 compared with control). (C) Average projected cell areas of the control and compressed 67NR cells at the leading edge of the “wound” and those in the internal monolayer, far from the edge (n = 8–9; NS, not significant; *P < 0.005 compared with the control in the same group). (D) Comparison of average cell lengths in control and compressed samples. Frontal length (filopodial protrusion length) was measured from the leading tip of the cell to its nucleus (*P < 0.005 compared with the control).
Fig. 3.
Fig. 3.
Free-cell perimeter determines leader-cell formation in control, but not compressed cultures. Shown are morphological changes and cell migration rates when 67NR cell monolayers (yellow and gray) were patterned into circles (A), rosettes (C), and squares (F) and cultured under stress-free (control) or compressed (5.8 mmHg) conditions. Solid and open triangles represent edge cells and point/corner cells, respectively (n = 6–8). (Scale bar, 100 μm.) (B) Average migration speed of control and compressed cells in circle patterns (n = 6–7; *P < 0.005). (D) Average migration speed of edge cells and point cells in the uncompressed cultures (n = 17; **P < 0.05 compared with edge cells). (E) Average migration speed of control and compressed cells in rosette patterns (n = 13–17; *P < 0.005). (G) Square patterns (500 × 500 μm) distort due to cell migration, and this pattern distortion can be quantified using a shape change index. For compressed cells, the index is ∼1, suggesting that the square pattern expands uniformly around the boundary; in contrast, control samples had much higher indexes, indicating that the shape expanded preferentially along the diagonals (n = 6; *P < 0.005).
Fig. 4.
Fig. 4.
Actomyosin contractility is not necessary for compression-induced leader-cell formation. (AC) Migration rates in the scratch-wound assay for 67NR cells transduced with dominant-negative RhoT19N retrovirus (A; n = 6) or treated with Y-27632 (B; n = 6–13), ML-7 (C; n = 6), or Blebbistatin (C; n = 6) under stress-free or compressed (5.8 mmHg) conditions for 16 h and corresponding representative images of 67NR leader cells at the wound edge (*P < 0.005 compared with the respective control; NS, not significant compared with the respective control). (Scale bar, 50 μm.) The inhibitors of actomyosin contractility did not abolish leader-cell formation despite reduced wound closure rate. (A) Western blot showing RhoA activation pull-down to analyze the transduction efficiency. Error bars represent SEM.
Fig. 5.
Fig. 5.
Compression up-regulates 67NR cell–matrix adhesion via localized fibronectin secretion. (A) Compression enhances cell-substrate adhesion. Uncompressed and compressed samples were exposed to detractive fluid shear and the remaining adherent cells were quantified using a colorimetric assay in which crystal violet stain was quantified via optical density (OD) at 540 nm (n = 8; *P < 0.005). (B) Quantification of fibronectin accumulation at the cell–substrate interface. Results are expressed as surface fibronectin-positive pixel area relative to the total number of DAPI-stained nuclei (n = 11–12; *P < 0.005 compared with the control). (C) Quantitative PCR of control and compressed 67NR cells showed no significant difference in fibronectin messenger level between the two groups (NS, not significant). (D) Fibronectin staining of 67NR cells at the periphery of the cell-denuded area. Fibronectin at the cell–substrate interface in the compressed, but not control, samples was fibrillar and oriented in the direction of migration (n = 17). (Scale bar, 10 μm.) (E) Vinculin-stained cells at the periphery of the cell-denuded area. 67NR cells were either uncompressed (control) or exposed to a compressive stress of 5.8 mmHg for 16 h. Vinculin-positive (red) focal adhesions were detected underneath compression-induced filopodia of elongated cells (n = 16). (Scale bar, 10 μm.) (F) Fibronectin staining of 67NR cells treated with 1 μM cycloheximide at the periphery of the cell-denuded area. The formation of oriented and fibril-like patterns of fibronectin observed earlier in the nontreated compressed cultures (D) was abolished after inhibition of protein synthesis, suggesting that the cells secrete fibronectin during their movement for enhanced cell–matrix adhesion (n = 8). (Scale bar, 10 μm.)
Fig. 6.
Fig. 6.
Proposed model of compression-modulated leader-cell formation and coordinated migration. (A) Cells seeded at the corners and edges of square islands have different extents of free perimeter, which affects actomyosin-driven intracellular stress. (B) In uncompressed cultures, free perimeter affects leader-cell formation. On average, the corner cells in the square islands have more free-cell perimeter than the edge cells and are therefore able to extend more protrusions than the edge cells, resulting in higher intracellular stress. (C) The resulting change in force balance within the cell likely causes their phenotypic change into “leader” cells. In our system, cell–cell adhesion is maintained, so cells adjacent to the leader cells (either behind or on the sides) appear to be pulled in the coordinated migration. As a result, the sheet preferentially extends from the corners of the square pattern. (D) In contrast, when the culture is compressed, all cells around the periphery of the island are deformed, or extruded, against the substrate, into the empty space. Similar to the case of the active extension of the uncompressed corner cells, cell extrusion has the effect of increasing cell-substrate contact (and also intracellular stress). (E) Hence, all cells around the periphery of the square pattern can become leader cells. The leader cells then continue to secrete and deposit fibronectin during cell spreading and movement, thereby forming new adhesion contacts with the substrate and resulting in enhanced coordinated migration.

References

    1. Fidler IJ, Poste G. The “seed and soil” hypothesis revisited. Lancet Oncol. 2008;9:808. - PubMed
    1. Wong SY, Hynes RO. Tumor-lymphatic interactions in an activated stromal microenvironment. J Cell Biochem. 2007;101:840–850. - PubMed
    1. Fukumura D, Duda DG, Munn LL, Jain RK. Tumor microvasculature and microenvironment: Novel insights through intravital imaging in pre-clinical models. Microcirculation. 2010;17:206–225. - PMC - PubMed
    1. Bierie B, Moses HL. Tumour microenvironment: TGFbeta: The molecular Jekyll and Hyde of cancer. Nat Rev Cancer. 2006;6:506–520. - PubMed
    1. Semenza GL. Defining the role of hypoxia-inducible factor 1 in cancer biology and therapeutics. Oncogene. 2010;29:625–634. - PMC - PubMed

Publication types