. 2012 Jan 10;109(2):419-24.
doi: 10.1073/pnas.1110865109. Epub 2011 Dec 27.

Single-cell proteomic chip for profiling intracellular signaling pathways in single tumor cells

Affiliations

Single-cell proteomic chip for profiling intracellular signaling pathways in single tumor cells

Qihui Shi et al. Proc Natl Acad Sci U S A. .

Abstract

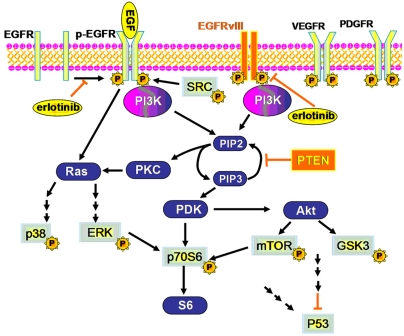
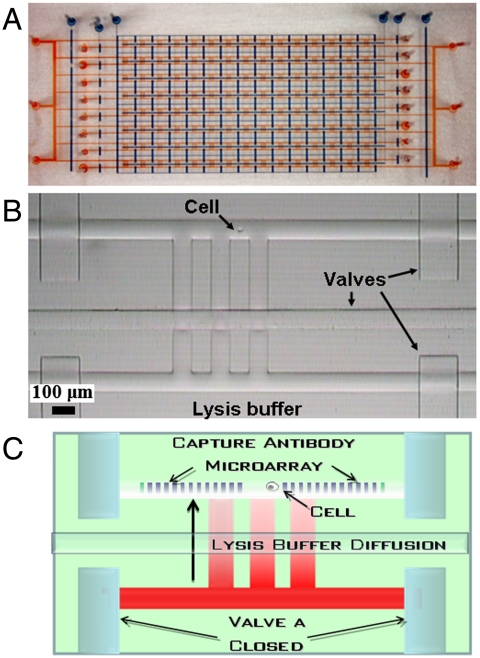
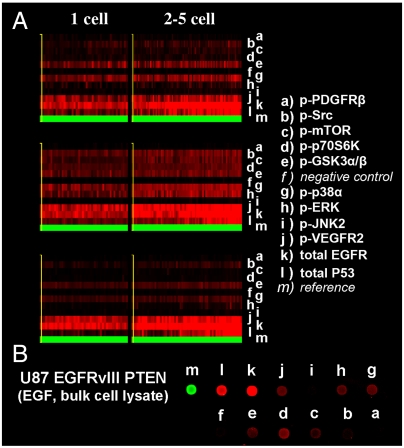
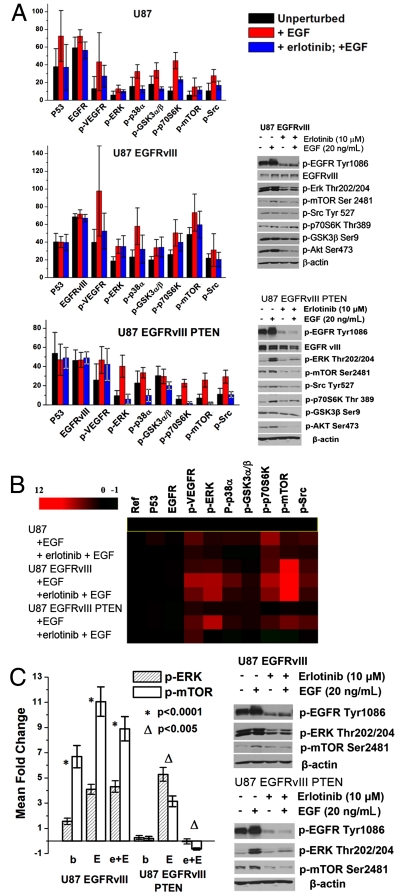
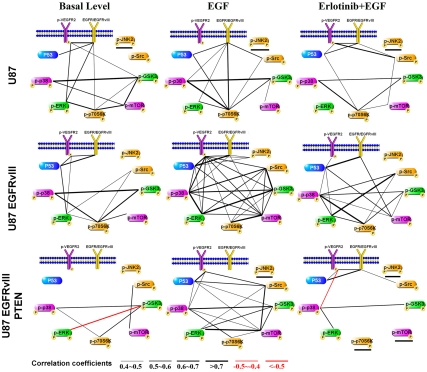
We describe a microchip designed to quantify the levels of a dozen cytoplasmic and membrane proteins from single cells. We use the platform to assess protein-protein interactions associated with the EGF-receptor-mediated PI3K signaling pathway. Single-cell sensitivity is achieved by isolating a defined number of cells (n = 0-5) in 2 nL volume chambers, each of which is patterned with two copies of a miniature antibody array. The cells are lysed on-chip, and the levels of released proteins are assayed using the antibody arrays. We investigate three isogenic cell lines representing the cancer glioblastoma multiforme, at the basal level, under EGF stimulation, and under erlotinib inhibition plus EGF stimulation. The measured protein abundances are consistent with previous work, and single-cell analysis uniquely reveals single-cell heterogeneity, and different types and strengths of protein-protein interactions. This platform helps provide a comprehensive picture of altered signal transduction networks in tumor cells and provides insight into the effect of targeted therapies on protein signaling networks.


Conflict of interest statement

The authors declare no conflict of interest.

Figures

Fig. 1.
Fig. 1.
The PI3K pathway activated by EGF-stimulated EGFR or by the constitutively activated EGFRvIII. All proteins in light blue with central yellow background were assayed. Orange background proteins were expressed in the cell lines U87 EGFRvIII or U87 EGFRvIII PTEN. The oval, yellow background components are the investigated molecular perturbations.
Fig. 2.
Fig. 2.
The single-cell barcode chip. (A) A photograph of an SCBC. The flow layer (red) and the control valve layer (blue) are delineated with food dyes. A photograph (B) and a drawing (C) of a single microchamber, with critical parts labeled. A cell is isolated in the cell chamber by the valves. The neighboring chamber contains cell lysis buffer. The duplicate DNA barcode copies are converted into an antibody array prior to cell loading, counting, and lysis. Also see SI Appendix, Fig. S1.
Fig. 3.
Fig. 3.
SCBC and bulk cell measurements of U87 EGFRvIII PTEN cells. (A) Heat maps of SCBC protein level assays. Each column represents one microchamber assay; each row represents a protein. (B) Protein assays from a population of U87 EGFRvIII PTEN cells under EGF stimulation. The contrast of these images has been equally adjusted, and the intensity of EGFR is divided by five in the heat maps.
Fig. 4.
Fig. 4.
Averaged responses for all three cell lines to EGF and erlotinib (eb) + EGF exposures. (A, Left) Measured protein expression profiles, in fluorescent intensity units, averaged over the three-cell measurements (n of approximately 20). The signal of EGFR/EGFRvIII is divided by 10. Results are shown as mean ± SD. SD represents the combined experimental error and intrinsic biological variation, but is dominated by the biological variation. (Right) Western blot analysis of p-EGFR, p-ERK, p-mTOR, p-Src, p-p70S6K, p-GSK3β, and p-Akt expression in U87 EGFRvIII and U87 EGFRvIII PTEN cell lines at the basal, EGF stimulation, and erlotinib + EGF treatment states. (B) Heat map of relative expression fold changes of proteins, normalized by unperturbed U87 cells. (C, Left) Mean fold change of phosphorylation levels of p-ERK and p-mTOR in different cell lines and conditions, relative to unperturbed U87 cells. (E, EGF; e + E, erlotinib + EGF). (Right) Western blot analysis of p-ERK and p-mTOR expression in response to EGF stimulation in U87 EGFRvIII and U87 EGFRvIII PTEN cell lines. These cells were cultured in DMEM medium containing 10% FBS for 24 h, then in serum-free medium for 24 h or (+) erlotinib (10 μM) treatment in serum-free medium, followed by stimulation (+) with EGF (20 ng/mL) for 15 min. Cells were lysed and the listed proteins were detected by Western blotting.
Fig. 5.
Fig. 5.
Protein correlation maps under different genetic and environmental perturbations. All indicated correlations pass a Bonferroni corrected p-value test (p = 0.05). Underlined proteins are below the detection limit.

References

    1. Reynoso D, Trent JC. Neoadjuvant and adjuvant imatinib treatment in gastrointestinal stromal tumor: Current status and recent developments. Curr Opin Oncol. 2010;22:330–335. - PubMed
    1. Lemmon MA, Schlessinger J. Cell signaling by receptor tyrosine kinases. Cell. 2010;141:1117–1134. - PMC - PubMed
    1. She Q-B, et al. 4E-BP1 is a key effector of the oncogenic activation of the AKT and ERK signaling pathways that integrates their function in tumors. Cancer Cell. 2010;18:39–51. - PMC - PubMed
    1. Janes KA, Reinhardt HC, Yaffe MB. Cytokine-induced signaling networks prioritize dynamic range over signal strength. Cell. 2008;135:343–354. - PMC - PubMed
    1. Marusyk A, Polyak K. Tumor heterogeneity: Causes and consequences. Biochim Biophys Acta Rev Cancer. 2010;1805:105–117. - PMC - PubMed

Publication types

MeSH terms

Substances

LinkOut - more resources