

Evolutionary constraints on visual cortex architecture from the dynamics of hallucinations
- PMID: 22203969
- PMCID: PMC3258647
- DOI: 10.1073/pnas.1118672109
Evolutionary constraints on visual cortex architecture from the dynamics of hallucinations
Abstract
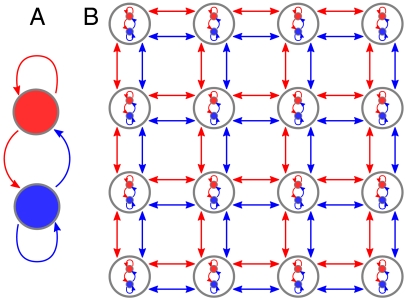
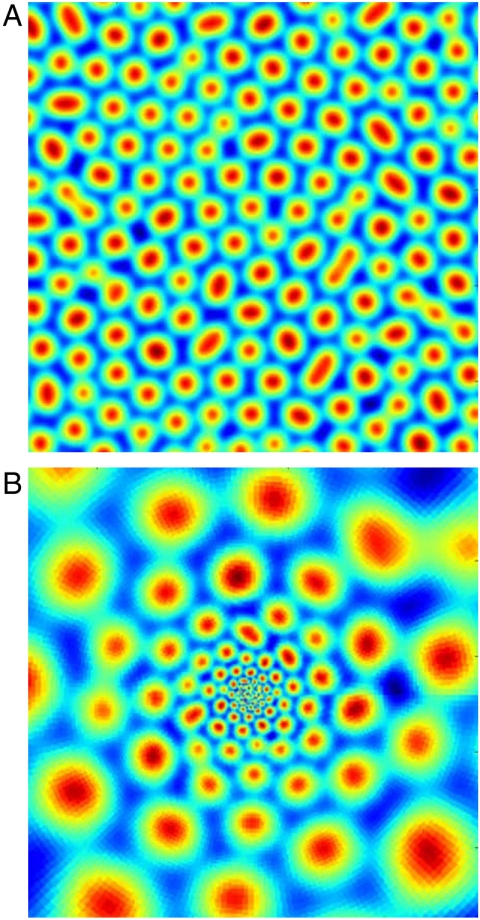
In the cat or primate primary visual cortex (V1), normal vision corresponds to a state where neural excitation patterns are driven by external visual stimuli. A spectacular failure mode of V1 occurs when such patterns are overwhelmed by spontaneously generated spatially self-organized patterns of neural excitation. These are experienced as geometric visual hallucinations. The problem of identifying the mechanisms by which V1 avoids this failure is made acute by recent advances in the statistical mechanics of pattern formation, which suggest that the hallucinatory state should be very robust. Here, we report how incorporating physiologically realistic long-range connections between inhibitory neurons changes the behavior of a model of V1. We find that the sparsity of long-range inhibition in V1 plays a previously unrecognized but key functional role in preserving the normal vision state. Surprisingly, it also contributes to the observed regularity of geometric visual hallucinations. Our results provide an explanation for the observed sparsity of long-range inhibition in V1--this generic architectural feature is an evolutionary adaptation that tunes V1 to the normal vision state. In addition, it has been shown that exactly the same long-range connections play a key role in the development of orientation preference maps. Thus V1's most striking long-range features--patchy excitatory connections and sparse inhibitory connections--are strongly constrained by two requirements: the need for the visual state to be robust and the developmental requirements of the orientational preference map.
Conflict of interest statement
The authors declare no conflict of interest.
Figures
 ,
,  with all other
  .
.
Similar articles
-
Spontaneous pattern formation and pinning in the primary visual cortex.J Physiol Paris. 2009 Jan-Mar;103(1-2):52-68. doi: 10.1016/j.jphysparis.2009.05.011. Epub 2009 Jun 10. J Physiol Paris. 2009. PMID: 19523514
-
Geometric visual hallucinations, Euclidean symmetry and the functional architecture of striate cortex.Philos Trans R Soc Lond B Biol Sci. 2001 Mar 29;356(1407):299-330. doi: 10.1098/rstb.2000.0769. Philos Trans R Soc Lond B Biol Sci. 2001. PMID: 11316482 Free PMC article. Review.
-
What geometric visual hallucinations tell us about the visual cortex.Neural Comput. 2002 Mar;14(3):473-91. doi: 10.1162/089976602317250861. Neural Comput. 2002. PMID: 11860679
-
An explanation of contextual modulation by short-range isotropic connections and orientation map geometry in the primary visual cortex.Biol Cybern. 2004 Dec;91(6):396-407. doi: 10.1007/s00422-004-0528-9. Epub 2004 Nov 25. Biol Cybern. 2004. PMID: 15597178
-
Elementary visual hallucinations and their relationships to neural pattern-forming mechanisms.Psychol Bull. 2012 Jul;138(4):744-74. doi: 10.1037/a0027580. Epub 2012 Mar 26. Psychol Bull. 2012. PMID: 22448914 Review.
Cited by
-
Non-reciprocal phase transitions.Nature. 2021 Apr;592(7854):363-369. doi: 10.1038/s41586-021-03375-9. Epub 2021 Apr 14. Nature. 2021. PMID: 33854249
-
Activation of serotonin 2A receptors underlies the psilocybin-induced effects on α oscillations, N170 visual-evoked potentials, and visual hallucinations.J Neurosci. 2013 Jun 19;33(25):10544-51. doi: 10.1523/JNEUROSCI.3007-12.2013. J Neurosci. 2013. PMID: 23785166 Free PMC article. Clinical Trial.
-
Fractional-Order Traveling Wave Approximations for a Fractional-Order Neural Field Model.Front Comput Neurosci. 2022 Mar 24;16:788924. doi: 10.3389/fncom.2022.788924. eCollection 2022. Front Comput Neurosci. 2022. PMID: 35399918 Free PMC article.
-
Phase transitions in in vivo or in vitro populations of spiking neurons belong to different universality classes.ArXiv [Preprint]. 2025 May 13:arXiv:2301.09600v4. ArXiv. 2025. PMID: 40463702 Free PMC article. Preprint.
-
Noise⁻Seeded Developmental Pattern Formation in Filamentous Cyanobacteria.Life (Basel). 2018 Nov 9;8(4):58. doi: 10.3390/life8040058. Life (Basel). 2018. PMID: 30423937 Free PMC article. Review.
References
-
- Hubel DH, Wiesel TN. Uniformity of monkey striate cortex: A parallel relationship between field size, scatter and magnification factor. J Comp Neurol. 1974;158:295–306. - PubMed
-
- Tootell RBH, Silverman MS, Switkes E, De Valois RL. Deoxyglucose analysis of retinotopic organization in primate striate cortex. Science. 1982;218:902–904. - PubMed
-
- Turing AM. The chemical basis of morphogenesis. Philos Trans R Soc B Biol Sci. 1952;237:37–72.
-
- Ermentrout GB, Cowan JD. A mathematical theory of visual hallucination patterns. Biol Cybern. 1979;34:137–150. - PubMed
Publication types
MeSH terms
LinkOut - more resources
Full Text Sources
Miscellaneous
