. 2012 Jan 10;109(2):570-5.
doi: 10.1073/pnas.1119059109. Epub 2011 Dec 27.

Hepatocyte growth factor (HGF) autocrine activation predicts sensitivity to MET inhibition in glioblastoma

Affiliations

Hepatocyte growth factor (HGF) autocrine activation predicts sensitivity to MET inhibition in glioblastoma

Qian Xie et al. Proc Natl Acad Sci U S A. .

Abstract

Because oncogene MET and EGF receptor (EGFR) inhibitors are in clinical development against several types of cancer, including glioblastoma, it is important to identify predictive markers that indicate patient subgroups suitable for such therapies. We investigated in vivo glioblastoma models characterized by hepatocyte growth factor (HGF) autocrine or paracrine activation, or by MET or EGFR amplification, for their susceptibility to MET inhibitors. HGF autocrine expression correlated with high phospho-MET levels in HGF autocrine cell lines, and these lines showed high sensitivity to MET inhibition in vivo. An HGF paracrine environment may enhance glioblastoma growth in vivo but did not indicate sensitivity to MET inhibition. EGFRvIII amplification predicted sensitivity to EGFR inhibition, but in the same tumor, increased copies of MET from gains of chromosome 7 did not result in increased MET activity and did not predict sensitivity to MET inhibitors. Thus, HGF autocrine glioblastoma bears an activated MET signaling pathway that may predict sensitivity to MET inhibitors. Moreover, serum HGF levels may serve as a biomarker for the presence of autocrine tumors and their responsiveness to MET therapeutics.


Conflict of interest statement

The authors declare no conflict of interest.

Figures
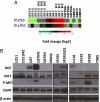
Fig. 1.
Fig. 1.
HGF expression level and MET phosphorylation in GBM cell lines. (A) Heat map of HGF expression changes between parental and M2 cell lines in vivo and in vitro. (B) Western blot of GBM cell lines and subclones showed that up-regulation of HGF expression is accompanied by increased p-MET.
Fig. 2.
Fig. 2.
HGF autocrine GBM tumors are sensitive to SGX523 in vivo. GBM cells (5 × 10⁵) were inoculated subcutaneously into SCID and SCIDhgf mice. When tumors had grown to 100–120 mm3, the mice bearing tumors of similar size were grouped for treatment as indicated. (A–C) HGF autocrine U87M2, SF295SQ1, and U118 tumors were sensitive to SGX523 treatment alone. (D–E) Non-HGF autocrine U251 and DBM2 tumors were not.
Fig. 3.
Fig. 3.
Erlotinib/SGX523 inhibition of U87M2 tumors. (A) SGX523 (90 mg/kg) in combination with erlotinib (150 mg/kg) inhibited U87M2 tumor growth. (B) Erlotinib (150 mg/kg) alone did not inhibit U87M2 tumor growth.
Fig. 4.
Fig. 4.
GBM cells with 7gainMET are not sensitive to MET inhibitors in vivo. (A) Cytogenetic analysis of X01GB stem cells in interphase (Center) and in metaphase (Left and Right), shown at 100× magnification. FISH signals detecting MET (red) and EGFR (green) showed EGFR amplification as dmin and a gain of MET. (B) RT-PCR of MET, EGFR, and EGFRvIII levels in X01GB and V13 xenografts. (C) Western blot of MET and EGFR expression and activation in X01GB and V13. (D) In vivo treatment efficacy of SGX523 and erlotinib on X01GB tumors. (E) Cytogenetic analysis of V13 cells and tumors shown at 100× magnification. Primary tumor nuclei and xenograft tumor nuclei show the same abnormalities. SKY analysis (Top Left) showed trisomy 7 in the V13 cell line. FISH signals showed MET (red), EGFR (green and aqua), HGF (green), and chromosome X (red). 7gain was detected by SKY and metaphase FISH; a high level of EGFR amplification occurred as dmin (Top Right). (F) In vivo treatment efficacy of SGX523 and erlotinib on V13 tumors.
Fig. 5.
Fig. 5.
In silico analysis of EGFR, HGF, and MET genetic aberrancy in GBM patients. (A) Self-organizing heat map based on transcriptional profiling of 202 GBM samples assayed by TCGA Network (11) on an Agilent 244K platform array. The map displays HGF, MET, and EGFR transcripts (rows) across the GBM samples (columns). The dendrogram indicates the degree of similarity among GBM samples using Pearson's correlation coefficient. Genes were projected using log2 intensity, and gene ratios were average corrected across experimental samples and displayed according to the uncentered correlation algorithm. Red indicates overexpression; green, underexpression; black, unchanged expression; and gray, no detection of expression (intensity of both Cy3 and Cy5 was below the cutoff value). (B) Matrix similarity based on Pearson's correlation for the HGF, MET, and EGFR transcripts in GBM samples. (C) CGH analysis of the frequency of amplifications occurring in the A–D groups. P value refers to the significance of correlation between EGFR, HGF, and MET gene copy number alteration and their transcriptional levels as shown in A. (D) Scatter plot between the average HGF intensity from the four groups described in Table S5 and the percentage of samples determined to have HGF autocrine activation. (E) Scatter plot between the average MET intensity from the four groups described in Table S5 and the percentage of samples determined to have HGF autocrine activation.

References

    1. Birchmeier C, Birchmeier W, Gherardi E, Vande Woude GF. Met, metastasis, motility and more. Nat Rev Mol Cell Biol. 2003;4:915–925. - PubMed
    1. Jeffers M, Rong S, Vande Woude GF. Enhanced tumorigenicity and invasion-metastasis by hepatocyte growth factor/scatter factor-MET signalling in human cells concomitant with induction of the urokinase proteolysis network. Mol Cell Biol. 1996;16:1115–1125. - PMC - PubMed
    1. Boccaccio C, Comoglio PM. Invasive growth: A MET-driven genetic programme for cancer and stem cells. Nat Rev Cancer. 2006;6(8):637–645. - PubMed
    1. Rao JS. Molecular mechanisms of glioma invasiveness: The role of proteases. Nat Rev Cancer. 2003;3(7):489–501. - PubMed
    1. Holland EC, et al. Combined activation of Ras and Akt in neural progenitors induces glioblastoma formation in mice. Nat Genet. 2000;25:55–57. - PubMed

MeSH terms