. 2012 Jun;69(11):1889-901.
doi: 10.1007/s00018-011-0908-y. Epub 2011 Dec 28.

Geometry sensing by dendritic cells dictates spatial organization and PGE(2)-induced dissolution of podosomes

Affiliations

Geometry sensing by dendritic cells dictates spatial organization and PGE(2)-induced dissolution of podosomes

Koen van den Dries et al. Cell Mol Life Sci. 2012 Jun.

Abstract

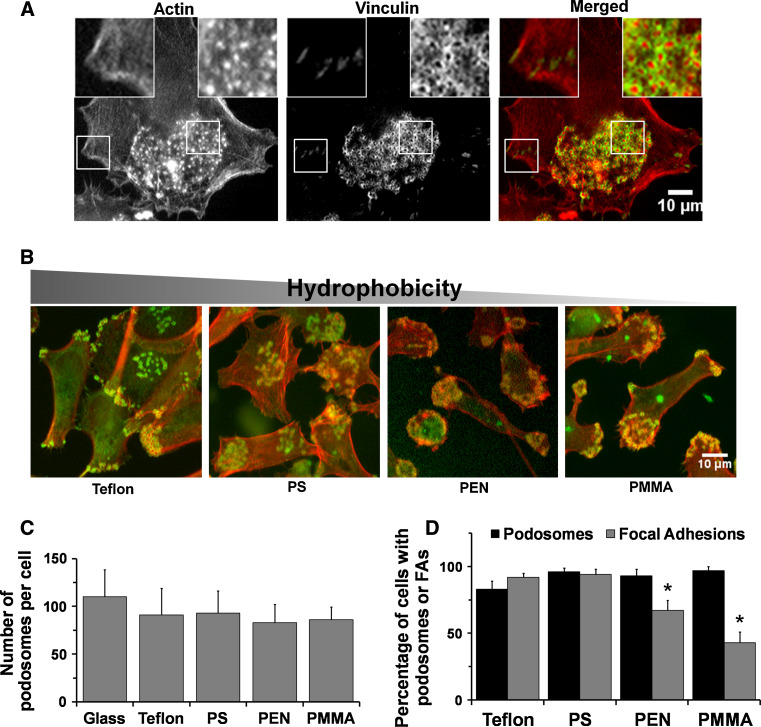
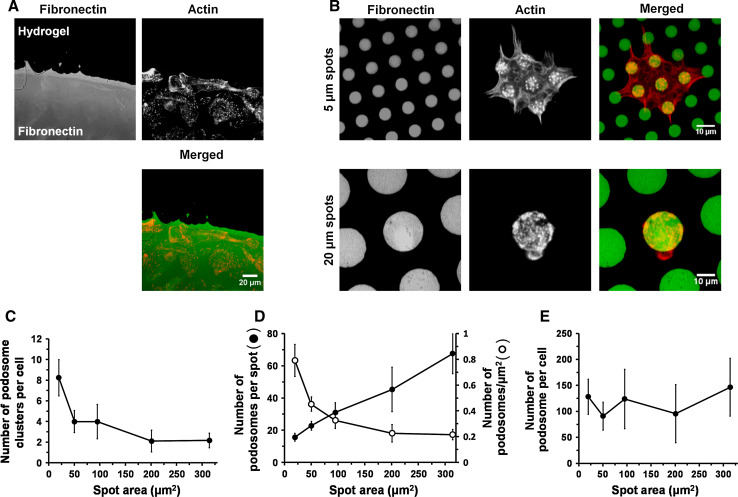
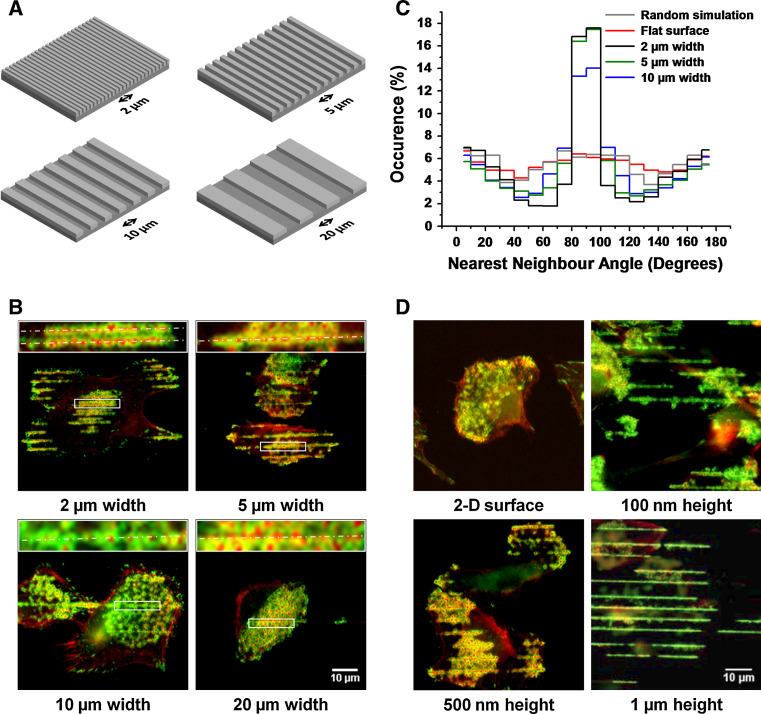
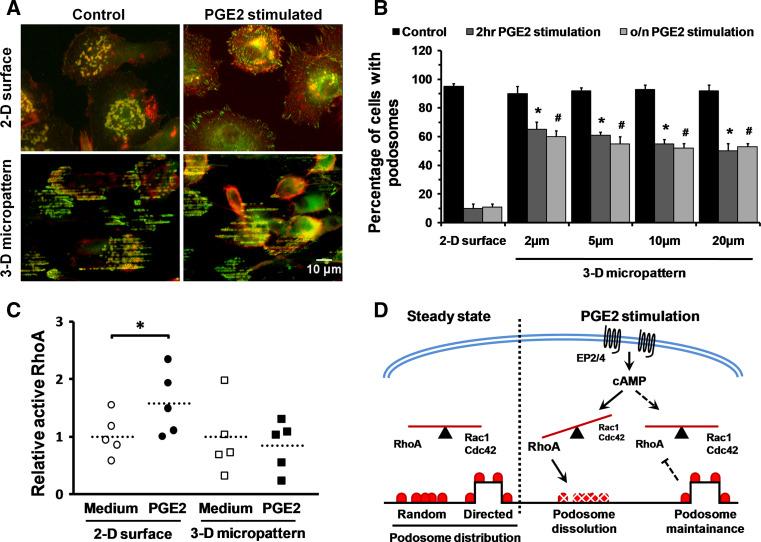
Assembly and disassembly of adhesion structures such as focal adhesions (FAs) and podosomes regulate cell adhesion and differentiation. On antigen-presenting dendritic cells (DCs), acquisition of a migratory and immunostimulatory phenotype depends on podosome dissolution by prostaglandin E(2) (PGE(2)). Whereas the effects of physico-chemical and topographical cues have been extensively studied on FAs, little is known about how podosomes respond to these signals. Here, we show that, unlike for FAs, podosome formation is not controlled by substrate physico-chemical properties. We demonstrate that cell adhesion is the only prerequisite for podosome formation and that substrate availability dictates podosome density. Interestingly, we show that DCs sense 3-dimensional (3-D) geometry by aligning podosomes along the edges of 3-D micropatterned surfaces. Finally, whereas on a 2-dimensional (2-D) surface PGE(2) causes a rapid increase in activated RhoA levels leading to fast podosome dissolution, 3-D geometric cues prevent PGE(2)-mediated RhoA activation resulting in impaired podosome dissolution even after prolonged stimulation. Our findings indicate that 2-D and 3-D geometric cues control the spatial organization of podosomes. More importantly, our studies demonstrate the importance of substrate dimensionality in regulating podosome dissolution and suggest that substrate dimensionality plays an important role in controlling DC activation, a key process in initiating immune responses.


Figures

Fig. 1
Fig. 1
Podosome formation is not influenced by substrate physico-chemical properties. a DCs seeded on glass form two types of adhesion structures. The cells were fixed and stained with phalloidin–Texas Red and an anti-vinculin mAb to visualize actin (red) and vinculin (green), respectively. Podosomes (right insert) can be seen as small circular structures, whereas FAs (left insert) are tangential. b Cells were seeded on Teflon, PS, PEN, and PMMA with Teflon being most hydrophobic and PMMA most hydrophilic. Cells were fixed and stained with phalloidin–Texas Red and an anti-vinculin mAb to visualize actin (red) and vinculin (green), respectively. Representative pictures are depicted. c Quantification of the number of podosomes per DC on surfaces with different hydrophobicity. Podosomes were counted in 15 cells in two independent experiments. Bars mean ± SD. d The number of cells displaying podosomes or FAs was counted in seven images per condition. Asterisks significant differences from Teflon (p < 0.05). Bars mean ± SEM
Fig. 2
Fig. 2
Podosomes formation is exclusively dependent on cell adhesion. a Hydrogels were coated with fibronectin mixed with rIgG-FITC (green) for visualization. DCs were seeded on the hydrogel and stained with phalloidin–Texas Red to visualize actin (red). Cells were found to adhere specifically to the fibronectin-coated areas. Representative image is depicted. Coating with rIgG-FITC alone was not sufficient for DC adherence (not shown). b Cells were seeded on fibronectin/rIgG1-FITC (green) printed hydrogel and fixed and stained with phalloidin–Texas Red to visualize actin (red). Representative images of cells seeded on 5- and 20-μm dots are depicted in the upper and lower panels, respectively. The distance between the spots is 7.5 and 10 μm for the 5- and 20-μm spots, respectively. c The number of podosome clusters per cell was quantified for the different sized dots and spacing. d Quantification of the number of podosomes per spot and the podosome density on the different sized spots. e Quantification of the number of podosomes per cell on the different sized spots. Spots with diameters of 5, 8, 11 16 and 20 µm were used for analysis. All quantifications include at least 15 cells per single spot size and graphs represent mean ± SD
Fig. 3
Fig. 3
Podosomes align along the edges of 3-D micropatterned substrates. a Schematic representation of the 3-D micropatterned substrates. 3-D micropatterns with widths of 2, 5, 10 and 20 μm and 1 μm height were fabricated. All 3-D micropatterns were fabricated such that the top and lower part had the same width. b DCs were seeded on 3-D micropatterned substrates with a height of 1 μm and widths of 2, 5, 10 and 20 μm. Cells were fixed and stained with phalloidin–Texas Red and an anti-vinculin mAb to visualize actin (red) and vinculin (green), respectively. The dotted lines in the insets indicate the position of the edges of the micropatterned substrate. Representative images are depicted. c The nearest neighbor angles (NNA) of podosomes (Fig. S3A in supplementary material) reveal the alignment of podosomes on the edges of 3-D patterns. The 2-μm 3-D micropattern induces a polarization of the NNA towards 90°. d DCs were seeded on a flat surface and on 3-D micropatterned substrates of 5 μm width and 100 nm, 500 nm and 1 μm height. Cells were fixed and stained with phalloidin–Texas Red and an anti-vinculin mAb to visualize actin (red) and vinculin (green), respectively. Representative images are depicted
Fig. 4
Fig. 4
3-D geometric cues influence podosome spatial organization and actin content. a Quantification of the number of podosomes per DC on 2-D and 3-D micropatterned substrates with widths of 2, 5, 10 and 20 μm together with the number of podosomes on the edges. Graphs represent mean ± SD of at least 20 cells per condition. b Inward and outward curvatures are created at the plasma membrane at the upper and lower edge of the 3-D micropattern. DCs were seeded on micropatterns with a height of 1 μm. Z-stacks were taken every 300 nm. Podosomes align on both the upper and the lower corner of the pattern. Shown are the lower and upper plane of the z-stack. The white dashed line represents the slice of the orthogonal view shown in Bb. c Nearest neighbor distance was determined for podosomes on 3-D micropatterns and 2-D surfaces. The average inter-podosomal distance on flat surfaces and patterns was 1.93 ± 0.54 μm (n = 4,342) and 1.91 ± 0.79 μm (n = 6,177), respectively (p = 0.16). d Cells were fixed and stained with phalloidin–Texas Red to visualize actin. The maximum Texas Red intensity on 3-D micropatterns and 2-D surfaces was 128 ± 62 (n = 1,387) and 83 ± 40 (n = 2,791), respectively (p < 0.01). Insets in (c) and (d) show podosomes on a flat 2-D surface and a 3-D micropattern. Podosomes are visualized by staining actin (red) and vinculin (green) with phalloidin–Texas Red and a vinculin-mAb, respectively
Fig. 5
Fig. 5
3-D geometric cues inhibit PGE2-mediated podosome dissolution. a iDCs were seeded on a 2-D surface and 3-D micropatterns and left untreated or stimulated with 10 μg/ml PGE2. The cells were fixed and stained for phalloidin–Texas Red and an anti-vinculin mAb to visualize actin (red) and vinculin (green), respectively. Representative images are depicted. b The number of cells that contained podosomes was determined for seven images per condition. Bars mean ± SEM. *p < 0.05 compared to 2 h PGE2 stimulation on 2-D surface, # p < 0.05 compared to o/n PGE2 stimulation on 2-D surface. c PGE2-mediated activation of the small GTPase RhoA was measured on 2-D surfaces and 3-D micropatterned substrates by a luminometric G-LISA assay. Data were normalized to the active RhoA levels in the absence of PGE2. Dotted line represents the average of five independent donors performed in duplicate (*p < 0.05). d Schematic model of podosome distribution/dissolution on 2-D surfaces and 3-D micropatterned substrates. Whereas DCs form podosomes at random on 2-D surfaces, they specifically align their podosomes on the edges of 3-D micropatterned substrates. On 2-D surfaces, PGE2 causes a rapid increase in RhoA activity leading to global podosome dissolution. In contrast, signals derived from signaling platforms induced by the 3-D micropatterns are able to prevent increased RhoA activity and thereby podosome dissolution

Similar articles

Cited by

References

    1. Orr AW, Helmke BP, Blackman BR, Schwartz MA. Mechanisms of mechanotransduction. Dev Cell. 2006;10(1):11–20. doi: 10.1016/j.devcel.2005.12.006. - DOI - PubMed
    1. Thery M, Racine V, Piel M, Pepin A, Dimitrov A, Chen Y, Sibarita JB, Bornens M. Anisotropy of cell adhesive microenvironment governs cell internal organization and orientation of polarity. Proc Natl Acad Sci USA. 2006;103(52):19771–19776. doi: 10.1073/pnas.0609267103. - DOI - PMC - PubMed
    1. Engler AJ, Sen S, Sweeney HL, Discher DE. Matrix elasticity directs stem cell lineage specification. Cell. 2006;126(4):677–689. doi: 10.1016/j.cell.2006.06.044. - DOI - PubMed
    1. Fereol S, Fodil R, Laurent VM, Balland M, Louis B, Pelle G, Henon S, Planus E, Isabey D. Prestress and adhesion site dynamics control cell sensitivity to extracellular stiffness. Biophys J. 2009;96(5):2009–2022. doi: 10.1016/j.bpj.2008.10.072. - DOI - PMC - PubMed
    1. Bershadsky A, Kozlov M, Geiger B. Adhesion-mediated mechanosensitivity: a time to experiment, and a time to theorize. Curr Opin Cell Biol. 2006;18(5):472–481. doi: 10.1016/j.ceb.2006.08.012. - DOI - PubMed