. 2011 Dec 1;149(4):499-515.
doi: 10.4449/aib.v149i4.1385.

Quantitative differences among EMG activities of muscles innervated by subpopulations of hypoglossal and upper spinal motoneurons during non-REM sleep - REM sleep transitions: a window on neural processes in the sleeping brain

Affiliations

Quantitative differences among EMG activities of muscles innervated by subpopulations of hypoglossal and upper spinal motoneurons during non-REM sleep - REM sleep transitions: a window on neural processes in the sleeping brain

I Rukhadze et al. Arch Ital Biol. .

Abstract

In the rat, a species widely used to study the neural mechanisms of sleep and motor control, lingual electromyographic activity (EMG) is minimal during non-rapid eye movement (non-REM) sleep and then phasic twitches gradually increase after the onset of REM sleep. To better characterize the central neural processes underlying this pattern, we quantified EMG of muscles innervated by distinct subpopulations of hypoglossal motoneurons and nuchal (N) EMG during transitions from non-REM sleep to REM sleep. In 8 chronically instrumented rats, we recorded cortical EEG, EMG at sites near the base of the tongue where genioglossal and intrinsic muscle fibers predominate (GG-I), EMG of the geniohyoid (GH) muscle, and N EMG. Sleep-wake states were identified and EMGs quantified relative to their mean levels in wakefulness in successive 10 s epochs. During non-REM sleep, the average EMG levels differed among the three muscles, with the order being N>GH>GG-I. During REM sleep, due to different magnitudes of phasic twitches, the order was reversed to GG-I>GH>N. GG-I and GH exhibited a gradual increase of twitching that peaked at 70-120 s after the onset of REM sleep and then declined if the REM sleep episode lasted longer. We propose that a common phasic excitatory generator impinges on motoneuron pools that innervate different muscles, but twitching magnitudes are different due to different levels of tonic motoneuronal hyperpolarization. We also propose that REM sleep episodes of average durations are terminated by intense activity of the central generator of phasic events, whereas long REM sleep episodes end as a result of a gradual waning of the tonic disfacilitatory and inhibitory processes.


Figures

Fig. 1
Fig. 1
Location of the recording sites in the proximal region of the tongue where genioglossus and intrinsic muscle fibers are intermixed (GG-I) and in the geniohyoid (GH) muscle. The sites were localized post-mortem and superimposed on a parasagittal cross-section of the tongue and GH muscle (only the proximal part of the tongue near its base is shown). GG-I EMG was recorded from 6 rats (filled circles) and GH activity also from 6 rats (open circles). Simultaneous recordings from both locations were obtained from 4 of the 8 rats included in this study. The numbers denote different animals.
Fig. 2
Fig. 2
Example of GG-I, GH and N activities during the transition from wakefulness to non-REM sleep and then REM sleep that ends with an awakening. In panel A, note that, during non-REM sleep, the nuchal (N) EMG gradually declines and then exhibits a distinct further decline at the onset of REM sleep, whereas GG-I and GH EMGs are atonic, or nearly atonic and show no distinct decline at the onset of REM sleep. After the onset of REM sleep, all three muscles exhibit some degree of phasic twitching that starts with a delay after the entry into REM sleep and is most intense in the GG-I EMG. The awakening is characteristically first signaled by an intense burst of activity in N EMG, while GG-I and GH EMGs are activated later. Panel B shows the shaded in panel A portion of GG-I and GH records (9 s). The expanded records show that twitches in the two muscles occur with distinct timing. The GG-I and GH recordings are from the sites designated in Fig. 1 as #18.
Fig. 3
Fig. 3
Distribution of GG-I, GH and N EMG levels relative to each other during different behavioral states. GG-I, GH and N EMG levels were normalized by their mean levels during wakefulness (W), color-coded by behavioral state, and their root mean square (RMS) values plotted for all 720 successive 10 s intervals of a 2 h recording of undisturbed behavior. GG-I and GH activity levels are more closely correlated with each other across all behavioral states (A) than GG-I activity is with N activity (B). Characteristic for the GG-I vs. N scatter plot is the upward shift of N EMG levels relative to GG-I EMG levels for many epochs during non-REM sleep (blue symbols) and a major downward shift of N EMG levels relative to GG-I EMG levels during REM sleep (red symbols). The GG-I and GH recording sites for this example correspond to animal #18 in Fig. 1.
Fig. 4
Fig. 4
Mean GG-I, GH and N EMG levels during non-REM sleep and REM sleep normalized by the mean activity during W. The levels differ significantly among the three muscles during both stages of sleep. During non-REM sleep, GG-I EMG is minimal (atonic) and significantly lower than N EMG. The mean GH EMG level is intermediate between the GG-I and N EMG levels. During REM sleep, N EMG is minimal, whereas GG-I EMG is largest and GH EMG retains an intermediate position. N EMG declines significantly between non-REM sleep and REM sleep, which is an opposite change to that for the mean GG-I. GH EMG shows only a small trend towards increase during REM sleep compared to its mean level during non-REM sleep because it is slightly elevated above the level of atonia during non-REM sleep and when this tonic activity disappears during REM sleep it is replaced by a moderate level of twitching. During REM sleep, both the mean GG-I and GH EMG levels are significantly higher than the N EMG due to the low level of phasic activity in the latter.
Fig. 5
Fig. 5
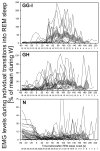
Time course of GG-I, GH and N EMG levels during transitions from non-REM sleep to REM sleep in individual segments of records that had at least 60 s of stable non-REM sleep followed by at least 60 s of REM sleep. EMG levels in successive 10 s intervals are shown for all segments of records with the state transitions that contained at least 60 s of continuous non-REM sleep followed by at least 60 s of continuous REM sleep (15 segments for GG-I from 6 rats, 19 for GH from 6 rats, and 26 for N from 8 rats). There is a gradual drop-out of traces due to variable duration of REM sleep episodes beyond 60 s; the numbers of segments included at each time point are shown below the abscissae. EMG levels are normalized by their mean levels in W. GG-I activity is nearly absent during non-REM sleep in most episodes, whereas GH and N EMGs have tonic activity. Then, GG-I and GH, and to a much lesser extent N, EMG show a gradually increasing magnitude of twitching after the onset of REM sleep (time zero) that reaches a maximum at 70–120 s and then declines. Shaded areas show the corresponding mean EMG levels ± SE during successive 10 s epochs.
Fig. 6
Fig. 6
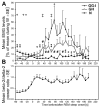
Quantitative comparison of mean GG-I, GH and N activities during transitions from non-REM sleep to REM sleep. A: the average time course of GG-I, GH and N EMG levels during the same transitions from non-REM to REM sleep as those individually illustrated in Fig. 5. B: the mean level of the ratio of cortical EEG powers in the beta-2 to delta-2 range at the corresponding time points before and after the onset of REM sleep. During the early phase of non-REM sleep, N EMG level is significantly higher than GH or GG-I EMGs and then declines. From about 20 s after the onset of REM sleep onwards, both GG-I and GH EMG levels begin to increase (twitching), whereas for the N EMG only a small contribution of twitching can be seen 60 s after the onset of REM sleep. The average GH EMG level is significantly higher than that of the N EMG at most times between 20 and 150 s after the onset of REM sleep, and GG-I EMG becomes higher than GH EMG at 60 s. Both the GG-I and GH reach a maximum at 70–120 s after REM sleep onset and then decline precipitously when REM sleep episodes last longer than 2 min. Thus, during the non-REM sleep period preceding the onset of REM sleep by about 30 s, the three muscles have different magnitudes with the order being N > GH > GG-I. In contrast, at 70–120 s into REM sleep, the order is N < GH < GG-I. *, ** and # = N EMG level significantly different from GH EMG level at p < 0.05, p < 0.02 and p < 0.005, respectively. and = GG-I significantly different from GH EMG level at p < 0.05 and p < 0.02, respectively. For clarity, and because N and GG-I EMG levels are more separated than either N from GH or GH from GG-I EMG levels, markers for comparisons between N and GG-I EMG levels are omitted.
Fig. 7
Fig. 7
Schematic representation of the interaction between a common phasic event generator and the tonic dis-facilitatory and inhibitory inputs that decrease mononeuronal excitability during transitions from quiet W to non-REM sleep and then REM sleep. The scheme accounts for different dependence of orofacial (and probably also other cranial and distal skeletal) muscles and nuchal (and probably also other axial) muscles on the tonic wake-related excitation mediated by the aminergic systems and tonic active inhibition. Different magnitudes of twitching in different muscles are secondary to the magnitudes of tonic hyperpolarization imparted on different motoneuronal pools. In addition, the relatively stronger active inhibition of motoneurons that innervate axial muscles reduces membrane resistance, thereby reducing the effectiveness of phasic excitatory inputs. According to this scheme, there is one common central network that generates phasic events, a network that is gradually activated after the onset of REM sleep and then gradually becomes quiescent. The gradual waning of phasic activation is revealed during relatively long-lasting episodes of REM sleep, while the typical ones usually terminate around the time of most intense phasic activity. Accordingly, terminations of the typical episodes of REM sleep may be facilitated by intense activity in the central generator of phasic events, whereas the long episodes end as a result of gradual waning of the tonic disfacilitatory and inhibitory processes. Within the proposed framework, the scheme may be modified to account for altered activity in different motoneuronal pools after various pharmacological treatments and in disorders such as RBD or obstructive sleep apnea.

Similar articles

Cited by

References

    1. Aldes LD. Subcompartmental organization of the ventral (protrusor) compartment in the hypoglossal nucleus of the rat. J Comp Neurol. 1995;353:89–108. - PubMed
    1. Altschuler SM, Bao X, Miselis RR. Dendritic architecture of hypoglossal motoneurons projecting to extrinsic tongue musculature in the rat. J Comp Neurol. 1994;342:538–550. - PubMed
    1. Anaclet C, Pedersen NP, Fuller PM, Lu J. Brainstem circuitry regulating phasic activation of trigeminal motoneurons during REM sleep. PLoS One. 2010;5:e8788. - PMC - PubMed
    1. Arnulf I. The ‘scanning hypothesis’ of rapid eye movements during REM sleep: a review of the evidence. Arch Ital Biol. 2011;151:367–382. (this issue) - PubMed
    1. Aserinsky E, Kleitman N. Regularly occurring periods of eye motility, and concomitant phenomena, during sleep. Science. 1953;118:273–274. - PubMed

Publication types

LinkOut - more resources