. 2012 Apr;107(7):1795-807.
doi: 10.1152/jn.00924.2011. Epub 2011 Dec 28.

Synaptic pathways that shape the excitatory drive in an OFF retinal ganglion cell

Affiliations

Synaptic pathways that shape the excitatory drive in an OFF retinal ganglion cell

Ilya Buldyrev et al. J Neurophysiol. 2012 Apr.

Abstract

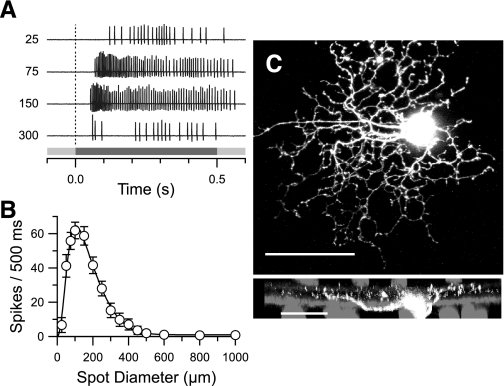
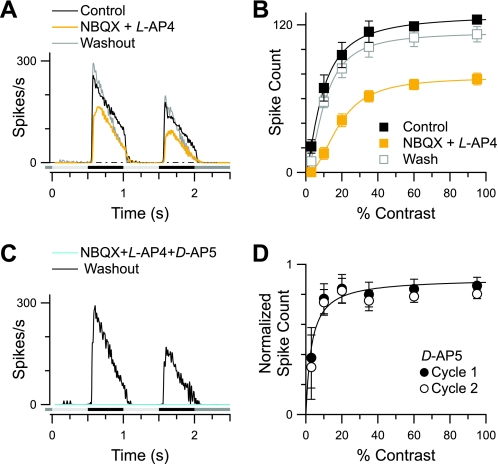
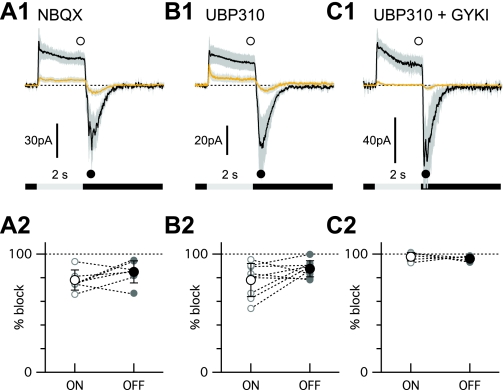
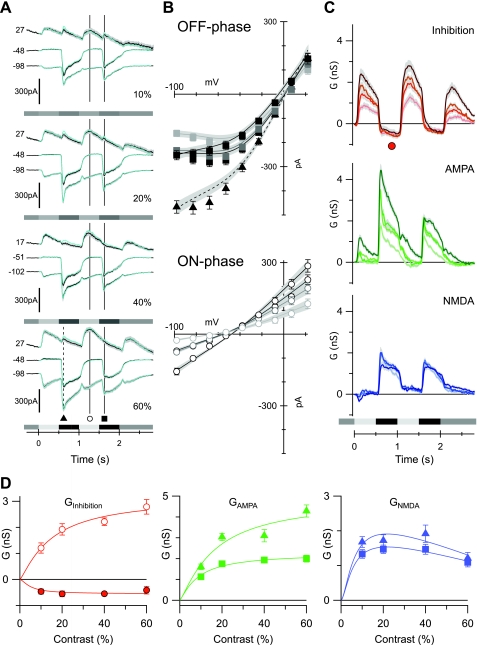
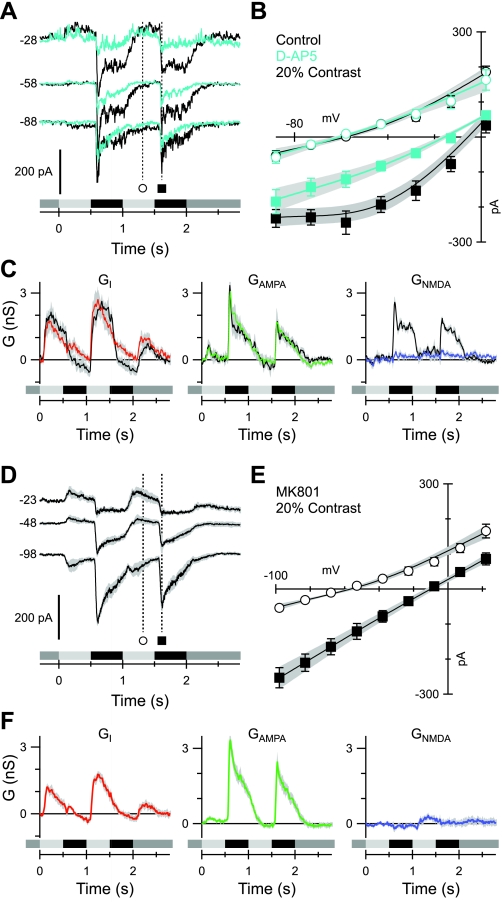
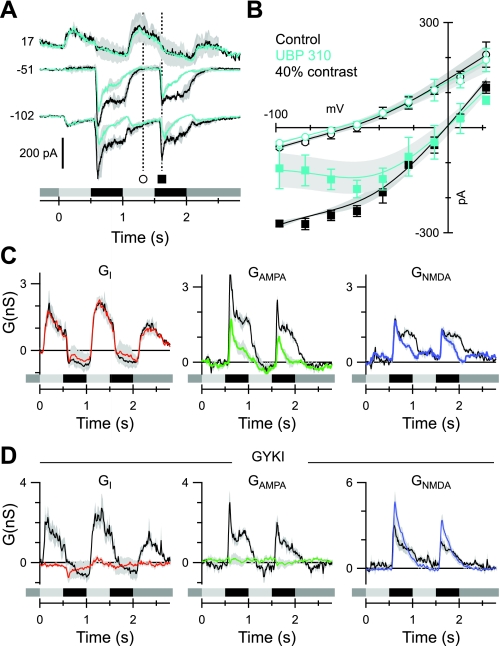
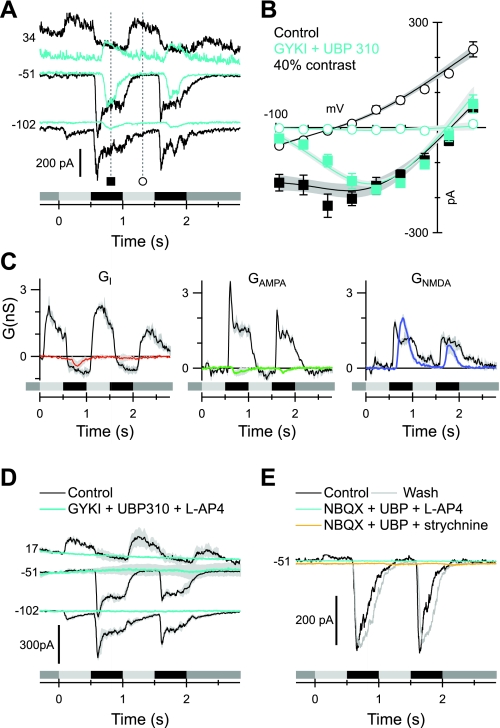
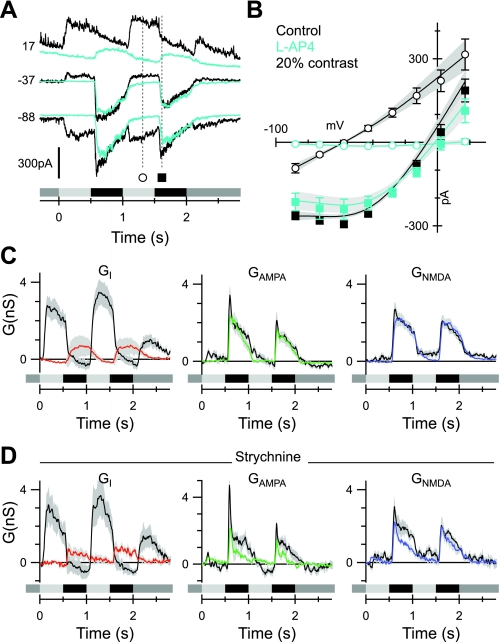
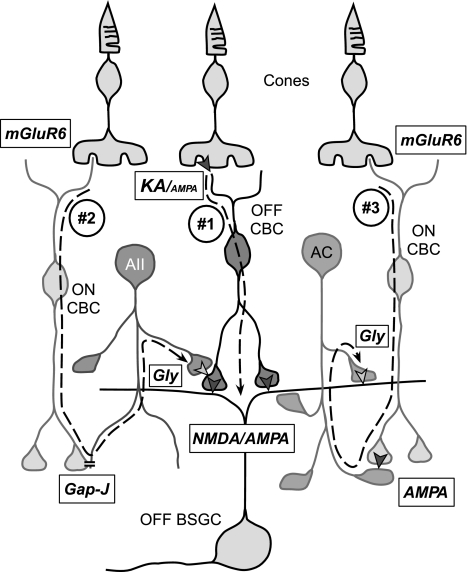
Different types of retinal ganglion cells represent distinct spatiotemporal filters that respond selectively to specific features in the visual input. Much about the circuitry and synaptic mechanisms that underlie such specificity remains to be determined. This study examines how N-methyl-d-aspartate (NMDA) receptor signaling combines with other excitatory and inhibitory mechanisms to shape the output of small-field OFF brisk-sustained ganglion cells (OFF-BSGCs) in the rabbit retina. We used voltage clamp to separately resolve NMDA, α-amino-3-hydroxy-5-methyl-4-isoxazolepropionic acid (AMPA), and inhibitory inputs elicited by stimulation of the receptive field center. Three converging circuits were identified. First is a direct glutamatergic input, arising from OFF cone bipolar cells (CBCs), which is mediated by synaptic NMDA and AMPA receptors. The NMDA input was saturated at 10% contrast, whereas the AMPA input increased monotonically up to 60% contrast. We propose that NMDA inputs selectively enhance sensitivity to low contrasts. The OFF bipolar cells, mediating this direct excitatory input, express dendritic kainate (KA) receptors, which are resistant to the nonselective AMPA/KA receptor antagonist, 2,3-dioxo-6-nitro-1,2,3,4-tetrahydrobenzo[f]quinoxaline-7-sulfonamide disodium salt (NBQX), but are suppressed by a GluK1- and GluK3-selective antagonist, (S)-1-(2-amino-2-carboxyethyl)-3-(2-carboxy-thiophene-3-yl-methyl)-5-methylpyrimidine-2,4-dione (UBP-310). The second circuit entails glycinergic crossover inhibition, arising from ON-CBCs and mediated by AII amacrine cells, which modulate glutamate release from the OFF-CBC terminals. The third circuit also comprises glycinergic crossover inhibition, which is driven by the ON pathway; however, this inhibition impinges directly on the OFF-BSGCs and is mediated by an unknown glycinergic amacrine cell that expresses AMPA but not KA receptors.


Figures

Fig. 1.
Fig. 1.
Physiological and anatomical properties of OFF brisk-sustained ganglion cells (BSGCs). A: spikes in an OFF-BSGC, evoked by a dark spot flashed for 0.5 s. The stimulus timing is shown by the gray bar (bottom). The stimulus spot diameter (μm) is shown to the left of each response. Firing rates peaked within 85 ms of stimulus onset and were sustained for optimally sized spots, 75 and 150 μm in diameter. B: the mean spike count during the stimulus presentation is plotted vs. stimulus diameter (±SE; n = 141). The continuous line shows the best fit to a difference-of-Gaussians function, with a center size (2σ center Gaussian) of 130 ± 12 μm and a surround of 460 ± 36 μm. C: confocal z-projection of an OFF-BSGC filled with Alexa-594 hydrazide. Dendrites from an adjacent-filled BSGC are visible (top; original scale bar = 50 μm). Bottom: side projection, which illustrates the diffuse vertical stratification in the outer 1/2 of the inner plexiform layer. For reference, the ON and OFF cholinergic amacrine cells, which stratify at 22% and 69% (Brandon 1987; Famiglietti 1987), were labeled with an antibody for choline acetyltransferase (gray; original scale bar = 25 μm).
Fig. 2.
Fig. 2.
2,3-Dioxo-6-nitro-1,2,3,4-tetrahydrobenzo[f]quinoxaline-7-sulfonamide disodium salt (NBQX)-resistant inputs in OFF-BSGCs. A: average spike-time histograms at the highest stimulus intensity (95% contrast) show the NBQX and L-(+)-2-amino-4-phosphonobutyric acid (L-AP4)-resistant response (yellow trace). B: mean spike count vs. stimulus contrast is reduced significantly but not blocked by 50 μM NBQX and 50 μM L-AP4 (n = 6). C: the addition of D-(−)-2-amino-5-phosphonopentanoic acid (D-AP5) in the presence of NBQX and L-AP4 reversibly eliminated all spiking (cyan trace). D: mean spike count in the presence of D-AP5 alone, normalized to control. D-AP5 suppressed spiking most strongly at the lowest contrast (3%; n = 5).
Fig. 3.
Fig. 3.
NBQX-resistant, light-evoked inputs to OFF bipolar cells. A1, B1, C1: average responses to 2-s diffuse light steps before (black traces) and after (yellow traces) the wash-in of 50 μM NBQX (A1), 10 μM (S)-1-(2-amino-2-carboxyethyl)-3-(2-carboxy-thiophene-3-yl-methyl)-5-methylpyrimidine-2,4-dione (UBP 310; B1), or a combination of 10 μM UBP 310 and 100 μM 1-(4-aminophenyl)-3-methylcarbamyl-4-methyl-3,4-dihydro-7,8-methylenedioxy-5H-2,3-benzodiazepine hydrochloride (GYKI 53655; C1). Shading shows the 95% confidence interval. The initial baseline current has been offset to 0 for comparison. The symbols show the time points used for the measurements shown in the lower panels. A2, B2, C2: summary of percentage block of the ON and OFF response components in individual bipolar cells treated with NBQX (A2), 10 μM UBP 310 (B2), or a combination of 10 μM UBP 310 and 100 μM GYKI 53655 (C2). A2: NBQX, n = 8 cells. Five cells that had similar response kinetics were averaged for the traces shown. B2: UBP 310. Average of 7 of the 8 cells recorded. One outlier was suppressed by only ∼20% and was omitted to perform the statistical comparison with the data in C2. C2: UBP 310 + GYKI 53655. Average from 5 cells.
Fig. 4.
Fig. 4.
Determination of the current-voltage (I-V) relation for the N-methyl-d-aspartate (NMDA) conductance in OFF-BSGCs. A: currents evoked by 2 mM NMDA puffs at indicated holding potentials ECl. The black bar, labeled “NMDA”, indicates the timing and duration of the puff; the gray bar indicates the period where the I-V in B was measured. B: leak-subtracted I-Vs of individual puff responses in 9 OFF-BSGCs (small ◊; ▴, data for the cell illustrated in A). Individual I-Vs have been normalized to have the average slope conductance for the dataset calculated for the most positive 3 data points. Large ◊, mean values ± SD. The solid, black line shows the fit to the mean data of the function describing the voltage dependence of NMDA receptor conductance [see materials and methods, Eq. 1, inhibitory conductance (Gi) = 0, and linear α-amino-3-hydroxy-5-methyl-4-isoxazolepropionic acid (AMPA)/kainate (KA) excitatory conductance (Ge) = 0)].
Fig. 5.
Fig. 5.
Contrast dependence of the excitatory and inhibitory synaptic inputs to OFF-BSGCs. The stimulus, a 100- to 120-μm diameter spot centered on the receptive field, was square-wave modulated at 1 Hz. Stimulus timing is indicated below the records in A and C. This stimulus applies to this and all subsequent figures. The contrast is shown at the bottom right of each panel in A. A: average currents from 36, 41, 28, and 33 cells at 10%, 20%, 40%, and 60% contrasts, respectively, at the holding potentials (mV) shown to the left of the traces. The superimposed cyan lines show the predicted currents reconstructed from the conductances shown in C. B: average light-evoked, series-resistance, corrected I-V relations obtained at the time points indicated in A. ▴, average currents at the indicated time point during the OFF phase of the 1st stimulus cycle; ○ and ■, ON phase and OFF phase of the 2nd stimulus cycle, respectively. The error bars show the SE, where they are larger than the symbols. The shading indicates increases in stimulus contrast (darkest indicates the highest contrast). The least-squares fits to the individual I-Vs were averaged from all of the cells and are shown by the solid lines; shading shows SE. This format is followed for the I-Vs in all subsequent figures. C: conductance components calculated every 10 ms for the duration of the light stimulus, from fits to average I-Vs, as illustrated in B for a single time point. The shaded regions show the SE. The Gi (Inhibition) is shown in red, the linear AMPA conductance (Glinear) is shown in green, and the NMDA conductance (GNMDA) is shown in blue, here and in all subsequent figures. D: the average amplitude of the inhibitory, AMPA, and NMDA conductance components, measured as a function of stimulus contrast. Mean conductances were measured over a 50-ms period at the time points shown by the corresponding symbols in A and C. The lines show empirical fits to the data.
Fig. 6.
Fig. 6.
Blocking NMDA receptors blocks the nonlinearity of the I-V relations. A: currents recorded at the indicated voltages (mV) in a representative cell before (black) and during (cyan) application of 50 μM D-AP5. B: example of average light-evoked I-V relations from 7 cells at the time points indicated in A. C: average conductances corresponding to the cells in B. The colored traces were obtained in the presence of D-AP5; control records are shown in black. Note that D-AP5 completely suppressed the NMDA component. D: average currents recorded from 5 cells at 20% contrast during whole-cell recording with 2 mM MK-801 in the recording electrode. At least 2 min were allowed for the MK-801 to equilibrate with the interior of the recorded cell before data collection. E: average I-V relations from the cells shown in D. F: conductances corresponding to the I-Vs shown in E. Note that the NMDA component is suppressed completely.
Fig. 7.
Fig. 7.
KA and AMPA receptor contribution to OFF-BSGC excitatory inputs. The format is similar to Fig. 6, A–C. A: average currents (n = 3), evoked by a 40% contrast stimulus, recorded at the indicated voltages (mV) before (black) and during (cyan) application of 10 μM UBP 310. B: example of average light-evoked I-V relations, measured at the time points indicated in A. C: average conductances corresponding to the currents in A. The colored traces were obtained in the presence of UBP 310. Control records are shown in black. UBP 310 suppressed the excitatory components but left the inhibition unaffected. D: average conductances as in C (n = 4) but in the presence of 100 μM GYKI 53655. The linear component of the excitation (green trace) is suppressed completely, indicating that it is mediated by AMPA receptors.
Fig. 8.
Fig. 8.
Blocking the OFF pathway reveals presynaptic crossover input from the ON pathway. The format is similar to Fig. 6, A–C. Data in B and C show averages from 3 cells. A: currents recorded at the indicated voltages (mV) in a representative cell before (black) and during (cyan) application of 100 μM GYKI 53655 plus 10 μM UBP 310. B: fits to the light-evoked I-V relations at the time points indicated in A. C: conductance components calculated from fits to the average I-Vs as illustrated in B. The colored traces were obtained in the presence of the blocking drugs. Control records are shown in black. Note the complete suppression of the linear inhibitory and excitatory components. D: average current traces (n = 4) showing that the addition of 50 μM L-AP4 blocks the residual NMDA inputs seen in the presence of 100 μM GYKI 53655 plus 10 μM UBP 310 (A). E: similarly, either 50 μM L-AP4 (cyan) or 0.5 μM strychnine (yellow) blocks the residual NMDA input seen in the presence of 100 μM NBQX plus 10 μM UBP 310. In this example, we successfully applied and washed out both L-AP4 and strychnine (gray).
Fig. 9.
Fig. 9.
Blocking the ON pathway suppresses direct crossover inhibition. The format is similar to Fig. 6, A–C. Data in B and C show averages from 10 cells. A: currents recorded at the indicated voltages (mV) in a representative cell before (black) and during (cyan) application of 50 μM L-AP4. B: average light-evoked I-V relations at the time points indicated in A. Note the complete suppression of the inhibition during the ON phase of the stimulus (open symbols). C: conductance components calculated from fits to the average I-Vs as illustrated in B. The colored traces were obtained in the presence of the blocking drugs; control records are shown in black. D: effects of 1 μM strychnine on the average conductances (n = 4 cells). The strychnine completely suppresses the inhibition during the ON phase.
Fig. 10.
Fig. 10.
Diagram showing the 3 OFF and ON pathways proposed to converge onto the OFF-BSGC. #1: direct excitatory inputs from OFF cone bipolar cells (CBCs), mediated by a combination of NMDA and AMPA receptors. The OFF-CBCs, providing the glutamatergic input to the OFF-BSGCs, are likely to receive a strong input mediated by synaptic GluK1-containing KA receptors in the outer plexiform layer. #2: crossover inhibition from the ON pathway proposed to modulate release of glutamate from OFF cone bipolar terminals. The crossover effect was insensitive to AMPA antagonists and thus is likely mediated via AII amacrine cells. #3: crossover inhibition, impinging directly onto the OFF-BSGC, is mediated by a glycinergic amacrine cell (AC) other than the AII, because it is abolished by AMPA receptor antagonists. The receptors mediating synaptic transmission are shown in the boxes: Gap-J, electrical gap junction-mediated synapse; Gly, glycinergic synapse; KA/AMPA, synapses mediated by a mix of KA and AMPA receptors; NMDA/AMPA, synapses mediated by a mix of NMDA and AMPA receptors; AMPA, synapse mediated purely by AMPA receptors; mGluR6, glutamatergic synapse mediated by type 6 metabotropic glutamate receptors.

Similar articles

Cited by

References

    1. Alt A, Weiss B, Ogden AM, Knauss JL, Oler J, Ho K, Large TH, Bleakman D. Pharmacological characterization of glutamatergic agonists and antagonists at recombinant human homomeric and heteromeric kainate receptors in vitro. Neuropharmacology 46: 793–806, 2004 - PubMed
    1. Amthor FR, Takahashi ES, Oyster CW. Morphologies of rabbit retinal ganglion cells with concentric receptive fields. J Comp Neurol 280: 72–96, 1989 - PubMed
    1. Atlason PT, Scholefield CL, Eaves RJ, Mayo-Martin MB, Jane DE, Molnar E. Mapping the ligand binding sites of kainate receptors: molecular determinants of subunit-selective binding of the antagonist [3H]UBP310. Mol Pharmacol 78: 1036–1045, 2010 - PMC - PubMed
    1. Berretta N, Jones RS. Tonic facilitation of glutamate release by presynaptic N-methyl-d-aspartate autoreceptors in the entorhinal cortex. Neuroscience 75: 339–344, 1996 - PubMed
    1. Boycott BB, Wässle H. The morphological types of ganglion cells of the domestic cat's retina. J Physiol 240: 397–419, 1974 - PMC - PubMed

Publication types

MeSH terms

Substances

LinkOut - more resources