Anion size modulates salt taste in rats
- PMID: 22205652
- PMCID: PMC3311674
- DOI: 10.1152/jn.00621.2011
Anion size modulates salt taste in rats
Abstract
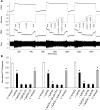
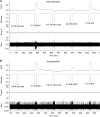
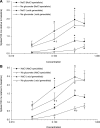
The purpose of this study was to investigate the influence of anion size and the contribution of the epithelial sodium channel (ENaC) and the transient receptor potential vanilloid-1 (TRPV1) channel on sodium-taste responses in rat chorda tympani (CT) neurons. We recorded multiunit responses from the severed CT nerve and single-cell responses from intact, narrowly tuned and broadly tuned, salt-sensitive neurons in the geniculate ganglion simultaneously with stimulus-evoked summated potentials to signal when the stimulus contacted the lingual epithelium. Artificial saliva served as the rinse and solvent for all stimuli (0.3 M NH(4)Cl, 0.5 M sucrose, 0.03-0.5 M NaCl, 0.01 M citric acid, 0.02 M quinine hydrochloride, 0.1 M KCl, and 0.03-0.5 M Na-gluconate). We used the pharmacological antagonist benzamil to assess NaCl responses mediated by ENaC, and SB-366791 and cetylpyridinium chloride to assess responses mediated by TRPV1. CT nerve responses were greater to NaCl than Na-gluconate at each concentration; this was attributed mostly to broadly tuned, acid-generalist neurons that responded with higher frequency and shorter latency to NaCl than Na-gluconate. In contrast, narrowly tuned NaCl-specialist neurons responded more similarly to the two salts, but with subtle differences in temporal pattern. Benzamil reduced CT nerve and single-cell responses only of narrowly tuned neurons to NaCl. Surprisingly, SB-366791 and cetylpyridinium chloride were without effect on CT nerve or single-cell NaCl responses. Collectively, our data demonstrate the critical role that apical ENaCs in fungiform papillae play in processing information about sodium by peripheral gustatory neurons; the role of TRPV1 channels is an enigma.
Figures


Similar articles
-
Acetic acid modulates spike rate and spike latency to salt in peripheral gustatory neurons of rats.J Neurophysiol. 2012 Nov;108(9):2405-18. doi: 10.1152/jn.00114.2012. Epub 2012 Aug 15. J Neurophysiol. 2012. PMID: 22896718 Free PMC article.
-
Gustatory neuron types in rat geniculate ganglion.J Neurophysiol. 1999 Dec;82(6):2970-88. doi: 10.1152/jn.1999.82.6.2970. J Neurophysiol. 1999. PMID: 10601433
-
Response latency to lingual taste stimulation distinguishes neuron types within the geniculate ganglion.J Neurophysiol. 2010 Apr;103(4):1771-84. doi: 10.1152/jn.00785.2009. Epub 2010 Jan 27. J Neurophysiol. 2010. PMID: 20107132 Free PMC article.
-
Differential Effect of TRPV1 Modulators on Neural and Behavioral Responses to Taste Stimuli.Nutrients. 2024 Nov 12;16(22):3858. doi: 10.3390/nu16223858. Nutrients. 2024. PMID: 39599644 Free PMC article. Review.
-
Cracking taste codes by tapping into sensory neuron impulse traffic.Prog Neurobiol. 2008 Nov;86(3):245-63. doi: 10.1016/j.pneurobio.2008.09.003. Epub 2008 Sep 7. Prog Neurobiol. 2008. PMID: 18824076 Free PMC article. Review.
Cited by
-
Acetic acid modulates spike rate and spike latency to salt in peripheral gustatory neurons of rats.J Neurophysiol. 2012 Nov;108(9):2405-18. doi: 10.1152/jn.00114.2012. Epub 2012 Aug 15. J Neurophysiol. 2012. PMID: 22896718 Free PMC article.
-
Sodium Carbonate is Saltier Than Sodium Chloride to Sodium-Depleted Rats.Chem Senses. 2017 Oct 1;42(8):647-653. doi: 10.1093/chemse/bjx043. Chem Senses. 2017. PMID: 28981821 Free PMC article.
-
Thirst Increases Chorda Tympani Responses to Sodium Chloride.Chem Senses. 2017 Oct 1;42(8):675-681. doi: 10.1093/chemse/bjx052. Chem Senses. 2017. PMID: 28981824 Free PMC article.
-
Individual differences in sour and salt sensitivity: detection and quality recognition thresholds for citric acid and sodium chloride.Chem Senses. 2013 May;38(4):333-42. doi: 10.1093/chemse/bjt003. Epub 2013 Feb 14. Chem Senses. 2013. PMID: 23413310 Free PMC article.
-
The Perceptual Characteristics of Sodium Chloride to Sodium-Depleted Rats.Chem Senses. 2017 Feb;42(2):93-103. doi: 10.1093/chemse/bjw100. Epub 2016 Sep 22. Chem Senses. 2017. PMID: 27660150 Free PMC article.
References
-
- Bealer SL. Intensity coding in the transient portion of the rat chorda tympani response. J Comp Physiol Psychol 92: 185–195, 1978 - PubMed
-
- Blough DS, Blough PM. Animal psychophysics. In: Handbook of Operant Behavior, edited by Honig WK, Staddon JER. Englewood Cliffs, NJ: Prentice-Hall, 1977
-
- Breza JM, Curtis KS, Contreras RJ. Monosodium glutamate but not linoleic acid differentially activates gustatory neurons in the rat geniculate ganglion. Chem Senses 32: 833–846, 2007 - PubMed
-
- Breza JM, Curtis KS, Contreras RJ. Temperature modulates taste responsiveness and stimulates gustatory neurons in the rat geniculate ganglion. J Neurophysiol 95: 674–685, 2006 - PubMed
Publication types
MeSH terms
Substances
Grants and funding
LinkOut - more resources
Full Text Sources
Miscellaneous

