. 2012 Mar;86(5):2416-27.
doi: 10.1128/JVI.06797-11. Epub 2011 Dec 28.

CD4 T cells promote CD8 T cell immunity at the priming and effector site during viral encephalitis

Affiliations

CD4 T cells promote CD8 T cell immunity at the priming and effector site during viral encephalitis

Timothy W Phares et al. J Virol. 2012 Mar.

Abstract

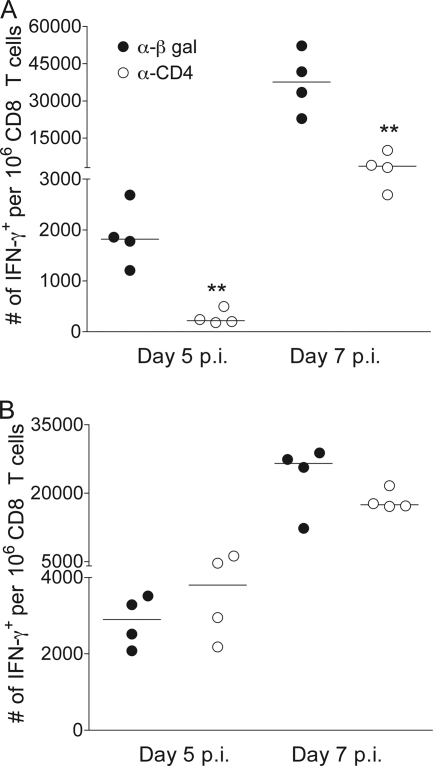
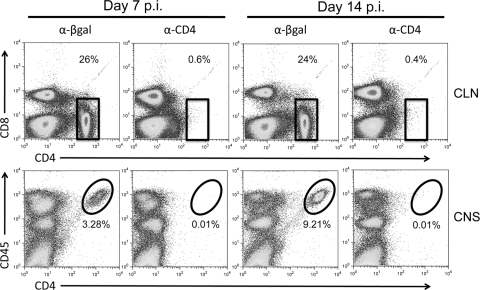
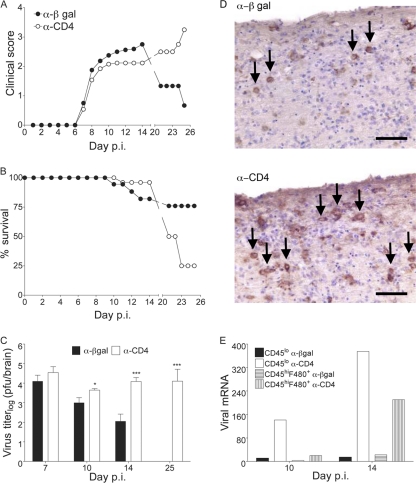
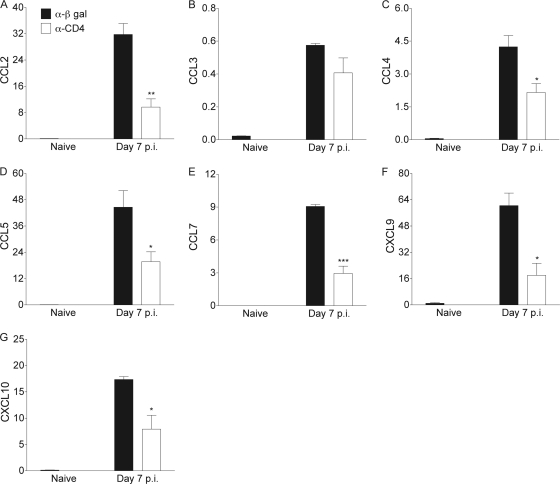
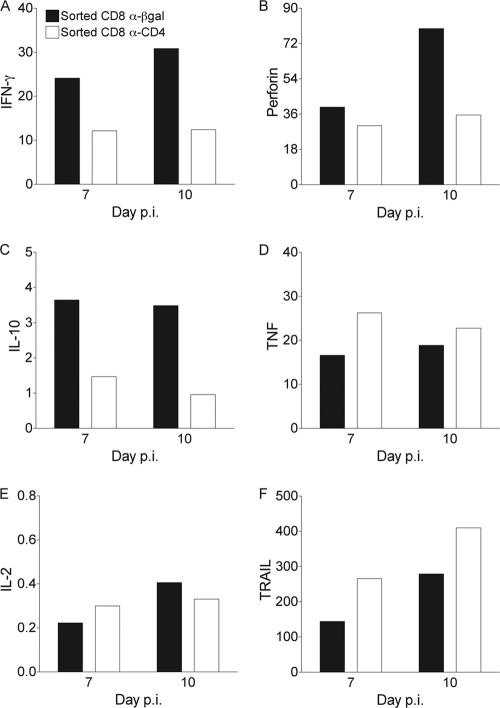
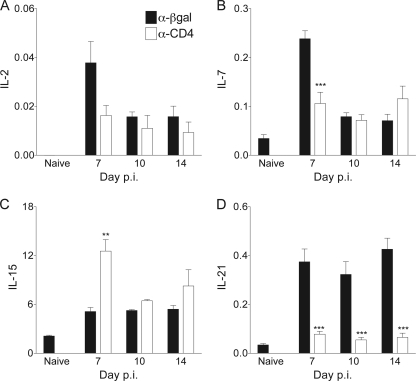
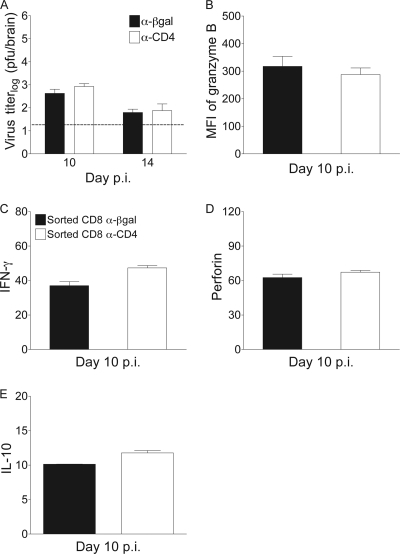
CD4 T cell activation during peripheral infections not only is essential in inducing protective CD8 T cell memory but also promotes CD8 T cell function and survival. However, the contributions of CD4 T cell help to antiviral CD8 T cell immunity during central nervous system (CNS) infection are not well established. Encephalitis induced by the sublethal coronavirus JHMV was used to identify when CD4 T cells regulate CD8 T cell responses following CNS infection. Peripheral expansion of virus-specific CD8 T cells was impaired when CD4 T cells were ablated prior to infection but not at 4 days postinfection. Delayed CD4 T cell depletion abrogated CD4 T cell recruitment to the CNS but only slightly diminished CD8 T cell recruitment. Nevertheless, the absence of CNS CD4 T cells was associated with reduced gamma interferon (IFN-γ) and granzyme B expression by infiltrating CD8 T cells, increased CD8 T cell apoptosis, and impaired control of infectious virus. CD4 T cell depletion subsequent to CD4 T cell CNS migration restored CD8 T cell activity and virus control. Analysis of γc-dependent cytokine expression indicated interleukin-21 (IL-21) as a primary candidate optimizing CD8 T cell activity within the CNS. These results demonstrate that CD4 T cells play critical roles in both enhancing peripheral activation of CD8 T cells and prolonging their antiviral function within the CNS. The data highlight the necessity for temporally and spatially distinct CD4 T cell helper functions in sustaining CD8 T cell activity during CNS infection.


Figures

Fig 1
Fig 1
Early but not delayed CD4 T cell depletion affects priming and expansion of peripheral naïve CD8 T cells. CD4 T cell were depleted either at −2, 0, and +2 days p.i. (A) or at 4 and 6 days p.i. (B). Frequencies of CLN-derived IFN-γ-secreting CD8 T cells at days 5 and 7 p.i. were determined by flow cytometry after stimulation with S510 peptide. Data are representative of results of two independent experiments and expressed as the numbers of IFN-γ+ per 106 CD8+ T cells. Statistically significant differences between the control and CD4 T cell-depleted samples are indicated as follows: **, P < 0.005.
Fig 2
Fig 2
α-CD4 MAb treatment prevents CD4 T cell accumulation in the CNS. JHMV-infected mice were treated with α-CD4 or control MAb at 4 and 6 days p.i. Pooled CLN (upper row) or brain cells (bottom row) (n ≥ 3/group) isolated at days 7 and 14 p.i. were stained for CD4, CD8, or CD45. Percentages of CD4+ T cells within the CLN (boxed cells) are shown in the upper right corner. Percentages of CD4+ T cells within the CNS (circled cells) are shown below the ellipse. Data are representative of results of three independent experiments.
Fig 3
Fig 3
Delayed depletion of CD4 T cells impairs viral control in the CNS. JHMV-infected mice were treated with α-CD4 or control MAb at 4 and 6 days p.i. and monitored for clinical symptoms (A), survival (B), and virus titers in brains by plaque assay (C). Titers are expressed as the means ± SEM. (D) Virus-infected cells in spinal cord white matter tracks of infected mice at 10 days p.i. Immunoperoxidase stain using α-nucleocapsid MAb (brown) with hematoxylin counterstain. Arrows indicate viral nucleocapsid Ag-positive cells with morphology consistent with oligodendroglia. Scale bar, 100 μm. (E) Relative transcript levels of viral nucleoprotein in purified CD45lo microglia and CD45hi F4/80+ monocyte-derived macrophages from pooled brains (n = 6) 10 and 14 days p.i. were assessed by real-time PCR. Transcript levels are relative to GAPDH. Statistically significant differences in overall clinical score up to day 14 p.i. between control and CD4 T cell-depleted mice were determined by Wilcoxon matched pairs test. **, P < 0.005. Statistically significant differences in viral titers between control and CD4 T cell-depleted mice were determined by unpaired t test. *, P < 0.5; ***, P < 0.001.
Fig 4
Fig 4
CD4 depletion reduces chemokine production in the CNS. JHMV-infected mice were treated with α-CD4 or control MAb at 4 and 6 days p.i. Relative transcript levels of CCL2 (A), CCL3 (B), CCL4 (C), CCL5 (D), CCL7 (E), CXCL9 (F), and CXCL10 (G) in spinal cords of naïve and infected mice were assessed by real-time PCR. Data are expressed as the mean transcript levels ± SEM relative to GAPDH mRNA from three to four individual mice and are representative of results of two independent experiments. Statistically significant differences between control and CD4 T cell-depleted mice were determined by unpaired t test. *, P < 0.5; **, P < 0.005; ***, P < 0.001.
Fig 5
Fig 5
CD4 T cells within the CNS are not required for CNS CD8 T cell recruitment. JHMV-infected mice were treated with α-CD4 or control MAb at 4 and 6 days p.i. CNS inflammation was analyzed by flow cytometry from pooled tissues of ≥3 mice and immunohistochemistry at the indicated time points. Numbers of total CD45hi CNS-infiltrating cells (A), CD8 T cells (B), Db/S510 tetramer+ virus-specific CD8 T cells (C), and CNS-infiltrating CD45hi F4/80+ macrophages (D) are shown. The data are expressed as the means ± SEM from two independent experiments with at least 3 mice per time point per experiment. CD3 localization in the brain of control (E) or CD4 T cell-depleted (F) mice at day 7 p.i. was analyzed using α-CD3 (green) and α-laminin (red) Ab. Scale bar, 50 μm.
Fig 6
Fig 6
Delayed CD4 ablation impairs antiviral effector function in the CNS. JHMV-infected mice were treated with α-CD4 or control MAb at 4 and 6 days p.i. (A) Pooled brain cells (n ≥ 4/group) isolated at days 7 and 10 p.i. were stained for CD8, Db/S510-specific T cell receptor (TCR) and intracellular granzyme B. Representative density plots depict staining with α-granzyme B Ab and Db/S510 tetramer. Plots are gated on CD8 T cells. Mean fluorescence intensity of granzyme B staining in Db/S510 tetramer+ virus-specific CD8 T cells is shown in the upper-right quadrant. Percentage of granzyme B+ Db/S510 tetramer+ virus-specific CD8 T cells is shown in parentheses. Data are representative of results of three independent experiments. (B) Brain IFN-γ levels were assessed by ELISA at the indicated days p.i. Data are means ± SEM (n ≥ 6/group) from two separate experiments. Statistically significant differences were determined by unpaired t test. **, P < 0.005. (C) Pooled brain cells (n ≥ 4/group) isolated at days 7 and 10 p.i. were stained for CD45 and MHC class II. Density plots are representative of two independent experiments and depict staining with α-CD45 and MHC class II Ab, with CD45lo microglia boxed. Microglia positive for MHC class II are depicted by the population falling into the right side of the box based on the separation of the MHC class II+ cells in the CD45hi population. Numbers are mean percentages ± SEM of MHC class II+ cells within the CD45lo microglia of both experiments.
Fig 7
Fig 7
Absence of CD4 T cells in the CNS impairs CD8 T cell activity. JHMV-infected mice were treated with α-CD4 or control MAb at 4 and 6 days p.i. (A to F) Relative transcript levels of IFN-γ (A), perforin (B), IL-10 (C), TNF (D), IL-2 (E), and TRAIL (F) in FACS-purified CD8 T cells from pooled brains of 6 to 8 mice collected at 7 and 10 days p.i. were assessed by real-time PCR. Data are representative of results of two independent experiments, and trends for each transcript were similar between experiments. Transcript levels are relative to GAPDH.
Fig 8
Fig 8
Absence of CNS CD4 T cells compromises CD8 T cell survival. JHMV-infected mice were treated with α-CD4 or control MAb at 4 and 6 days p.i. Brain cells from individual mice (n = 3 to 4) isolated at day 10 p.i. were stained for CD8, Annexin-V, and Ki-67. Percentages of Annexin-V+ (A) or Ki-67+ (B) CD8 T cells are shown. Data are representative of results of two independent experiments. Statistically significant differences were determined by unpaired t test. ***, P < 0.005.
Fig 9
Fig 9
Absence of CNS CD4 T cells abrogates IL-21 expression in the CNS. JHMV-infected mice were treated with α-CD4 or control MAb at 4 and 6 days p.i. Relative transcript levels of IL-2 (A), IL-7 (B), IL-15 (C), and IL-21 (D) in spinal cords of naïve and infected mice were assessed by real-time PCR. Data are expressed as the mean transcript level relative to GAPDH mRNA from 3 to 4 individual mice ± SEM and are representative of results of two independent experiments. Statistically significant differences between control and CD4 T cell-depleted mice were determined by unpaired t test. **, P < 0.005; ***, P < 0.001.
Fig 10
Fig 10
Depletion of CD4 T cells subsequent to CNS T cell infiltration restores viral control and CD8 T cell effector function. JHMV-infected mice were treated with α-CD4 or control MAb at 7 and 9 days p.i. (A) Virus titers in the brains were determined by plaque assay. Titers are expressed as means ± SEM. (B) Pooled brain cells (n ≥ 4/group) isolated at day 10 p.i. were stained for CD8 and intracellular granzyme B. Mean fluorescence intensity of granzyme B staining in CD8 T cells is shown. Relative transcript levels of IFN-γ (C), perforin (D), and IL-10 (E) in purified CD8 T cells from pooled brains on day 10 p.i. were assessed by real-time PCR. Transcript levels are relative to GAPDH, and data are representative of results of two independent experiments. Trends for each transcript were similar between experiments.

References

    1. Altfeld M, Rosenberg ES. 2000. The role of CD4+ T helper cells in the cytotoxic T lymphocyte response to HIV-1. Current Opin. Immunol. 12:375–380 - PubMed
    1. Barker BR, Gladstone MN, Gillard GO, Panas MW, Letvin NL. 2010. Critical role for IL-21 in both primary and memory anti-viral CD8+ T-cell responses. Eur. J. Immunol. 40:3085–3096 - PMC - PubMed
    1. Bergmann CC, Altman JD, Hinton D, Stohlman SA. 1999. Inverted immunodominance and impaired cytolytic function of CD8+ T cells during viral persistence in the central nervous system. J. Immunol. 163:3379–3387 - PubMed
    1. Bergmann CC, et al. 2004. Perforin and gamma interferon-mediated control of coronavirus central nervous system infection by CD8 T cells in the absence of CD4 T cells. J. Virol. 78:1739–1750 - PMC - PubMed
    1. Castellino F, et al. 2006. Chemokines enhance immunity by guiding naive CD8+ T cells to sites of CD4+ T cell-dendritic cell interaction. Nature 440:890–895 - PubMed

Publication types

MeSH terms