

Significant correlations between optic nerve head microcirculation and visual field defects and nerve fiber layer loss in glaucoma patients with myopic glaucomatous disk
- PMID: 22205831
- PMCID: PMC3245193
- DOI: 10.2147/OPTH.S23204
Significant correlations between optic nerve head microcirculation and visual field defects and nerve fiber layer loss in glaucoma patients with myopic glaucomatous disk
Abstract
Background: Eyes with glaucoma are characterized by optic neuropathy with visual field defects in the areas corresponding to the optic disk damage. The exact cause for the glaucomatous optic neuropathy has not been determined. Myopia has been shown to be a risk factor for glaucoma. The purpose of this study was to determine whether a significant correlation existed between the microcirculation of the optic disk and the visual field defects and the retinal nerve fiber layer thickness (RNFLT) in glaucoma patients with myopic optic disks.
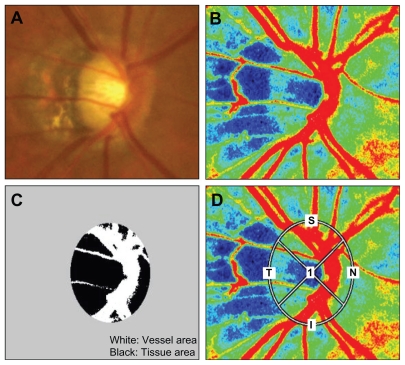
Methods: Sixty eyes of 60 patients with myopic disks were studied; 36 eyes with glaucoma (men:women = 19:17) and 24 eyes with no ocular diseases (men:women = 14:10). The mean deviation (MD) determined by the Humphrey field analyzer, and the peripapillary RNFLT determined by the Stratus-OCT were compared between the two groups. The ocular circulation was determined by laser speckle flowgraphy (LSFG), and the mean blur rate (MBR) was compared between the two groups. The correlations between the RNFLT and MBR of the corresponding areas of the optic disk and between MD and MBR of the optic disk in the glaucoma group were determined by simple regression analyses.
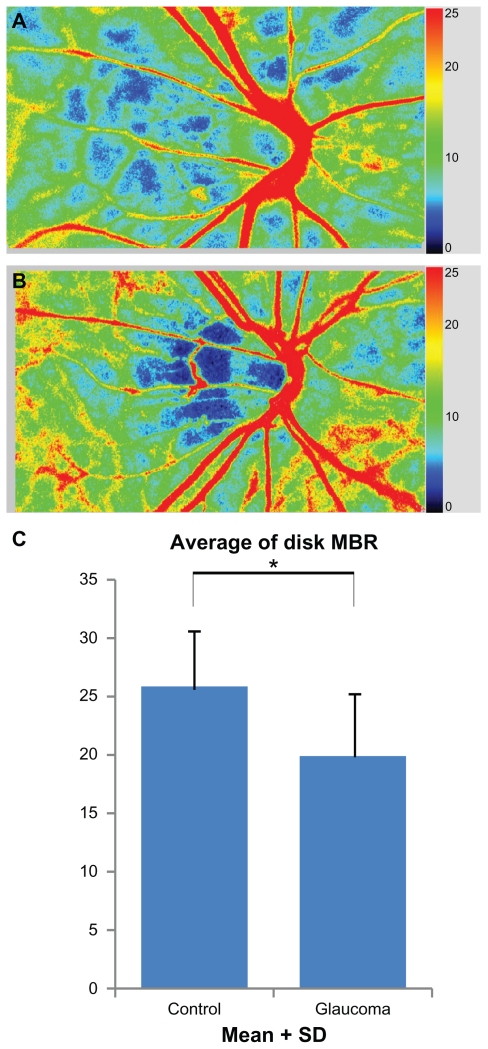
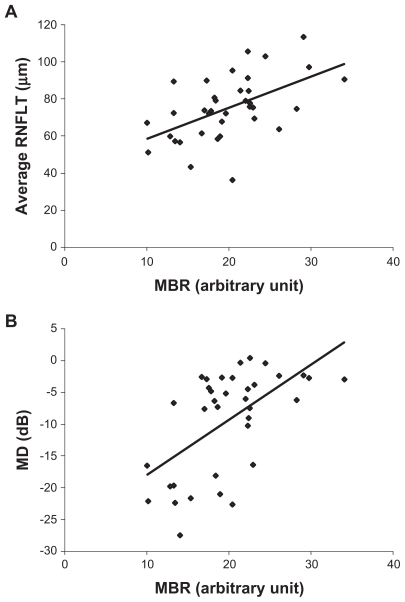
Results: The average MBR for the entire optic disk was significantly lower in the glaucoma group than that in the control group. The differences of the MBR for the tissue in the superior, inferior, and temporal quadrants of the optic disk between the two groups were significant. The MBR for the entire optic disk was significantly correlated with the MD (r = 0.58, P = 0.0002) and the average RNFLT (r = 0.53, P = 0.0008). The tissue MBR of the optic disk was significantly correlated with the RNFLT in the superior, inferior, and temporal quadrants.
Conclusions: Our study suggests that there is a causal relationship between the thinner RNFLT that led to the MD and reduction in the microcirculation in the optic nerve head.
Keywords: glaucoma; microcirculation; myopia; optic disk; optic nerve head; optic neuropathy; retinal nerve fiber layer; visual field defects.
Figures
References
-
- Suzuki Y, Iwase A, Araie M, et al. Risk factors for open-angle glaucoma in a Japanese population: the Tajimi Study. Ophthalmology. 2006;113(9):1613–1617. - PubMed
-
- Xu L, Wang Y, Wang S, Wang Y, Jonas JB. High myopia and glaucoma susceptibility the Beijing Eye Study. Ophthalmology. 2007;114(2):216–220. - PubMed
-
- Mitchell P, Hourihan F, Sandbach J, Wang JJ. The relationship between glaucoma and myopia: the Blue Mountains Eye Study. Ophthalmology. 1999;106(10):2010–2015. - PubMed
-
- Coleman AL, Miglior S. Risk factors for glaucoma onset and progression. Surv Ophthalmol. 2008;53(Suppl 1):S3–S10. - PubMed
-
- Leske MC, Wu SY, Hennis A, Honkanen R, Nemesure B. Risk factors for incident open-angle glaucoma: the Barbados Eye Studies. Ophthalmology. 2008;115(1):85–93. - PubMed
LinkOut - more resources
Full Text Sources
