. 2010;10(2):1062-92.
doi: 10.3390/s100201062. Epub 2010 Jan 29.

Evaluation of three electronic noses for detecting incipient wood decay

Affiliations

Evaluation of three electronic noses for detecting incipient wood decay

Manuela Baietto et al. Sensors (Basel). 2010.

Abstract

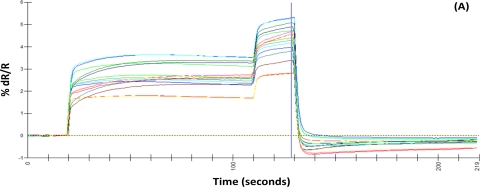
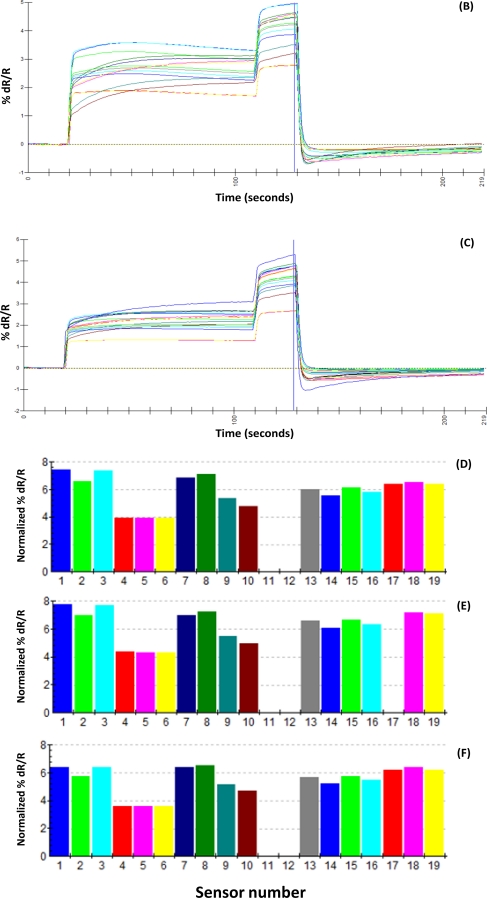
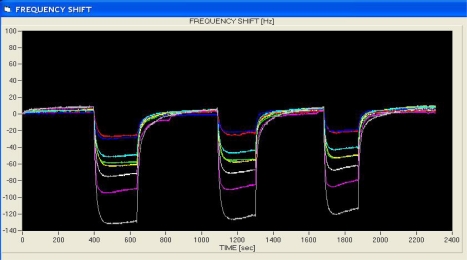
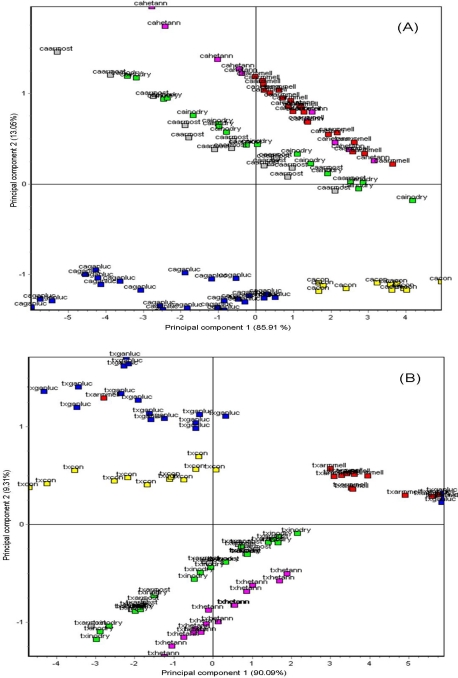
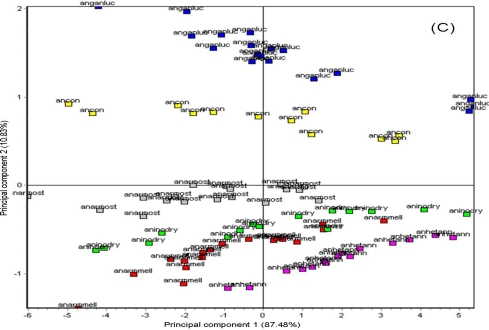
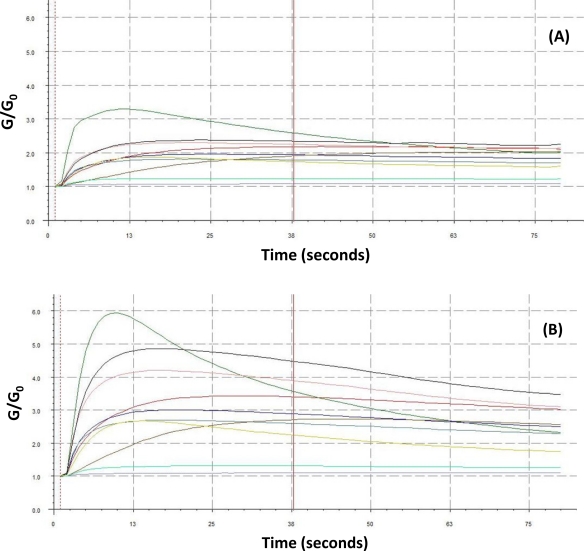
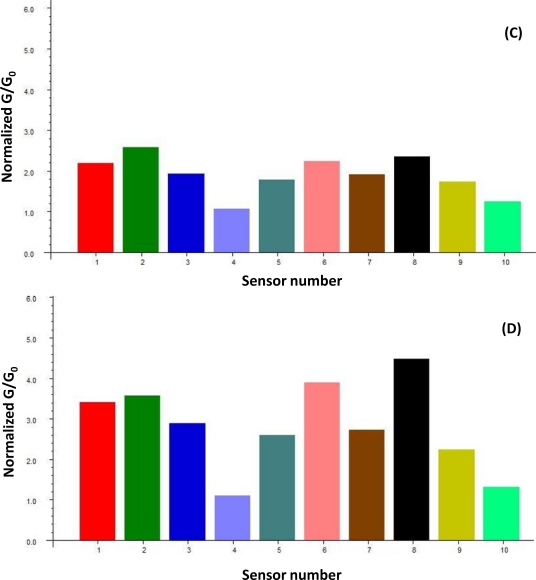
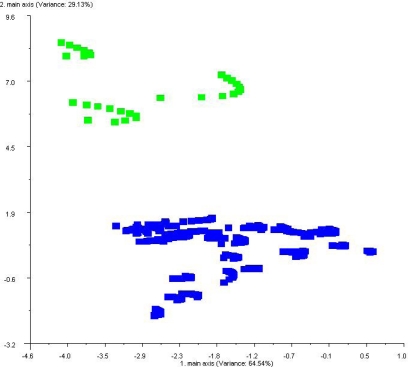
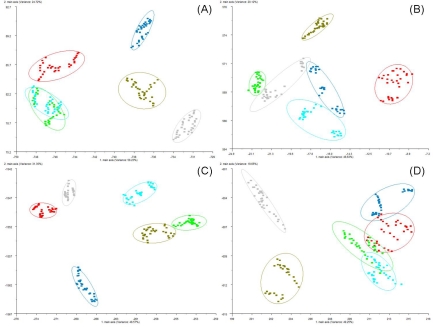
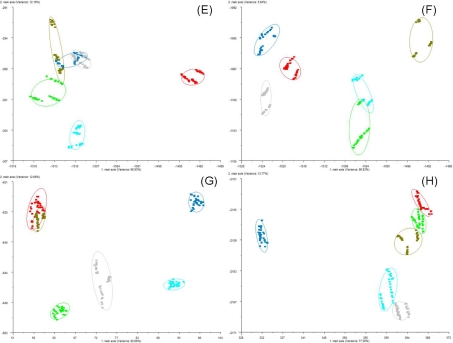
Tree assessment methodologies, currently used to evaluate the structural stability of individual urban trees, usually involve a visual analysis followed by measurements of the internal soundness of wood using various instruments that are often invasive, expensive, or inadequate for use within the urban environment. Moreover, most conventional instruments do not provide an adequate evaluation of decay that occurs in the root system. The intent of this research was to evaluate the possibility of integrating conventional tools, currently used for assessments of decay in urban trees, with the electronic nose-a new innovative tool used in diverse fields and industries for various applications such as quality control in manufacturing, environmental monitoring, medical diagnoses, and perfumery. Electronic-nose (e-nose) technologies were tested for the capability of detecting differences in volatile organic compounds (VOCs) released by wood decay fungi and wood from healthy and decayed trees. Three e-noses, based on different types of operational technologies and analytical methods, were evaluated independently (not directly compared) to determine the feasibility of detecting incipient decays in artificially-inoculated wood. All three e-nose devices were capable of discriminating between healthy and artificially-inoculated, decayed wood with high levels of precision and confidence. The LibraNose quartz microbalance (QMB) e-nose generally provided higher levels of discrimination of sample unknowns, but not necessarily more accurate or effective detection than the AromaScan A32S conducting polymer and PEN3 metal-oxide (MOS) gas sensor e-noses for identifying and distinguishing woody samples containing different agents of wood decay. However, the conducting polymer e-nose had the greater advantage for identifying unknowns from diverse woody sample types due to the associated software capability of utilizing prior-developed, application-specific reference libraries with aroma pattern-recognition and neural-net training algorithms.

Keywords: electronic aroma detection; tree hazard assessment; urban landscape tree species; wood-rotting fungi.


Figures

Figure 1.
Figure 1.
Typical sensor-response outputs from representative samples of healthy wood blocks (controls), inoculated wood blocks (decayed) and wood decay fungi pure cultures. Sensory array output are from: (A) a non-inoculated sample of Quercus lyrata, (B) a partially decayed wood sample of Q. lyrata after inoculation with Ganoderma lucidum, and (C) a sample of Ganoderma lucidum in pure culture. Histograms of normalized intensity responses of individual sensors to headspace volatiles produced by the same Q. lyrata-samples for non-inoculated (D), partially decayed (E), and pure culture (F), respectively.
Figure 1.
Figure 1.
Typical sensor-response outputs from representative samples of healthy wood blocks (controls), inoculated wood blocks (decayed) and wood decay fungi pure cultures. Sensory array output are from: (A) a non-inoculated sample of Quercus lyrata, (B) a partially decayed wood sample of Q. lyrata after inoculation with Ganoderma lucidum, and (C) a sample of Ganoderma lucidum in pure culture. Histograms of normalized intensity responses of individual sensors to headspace volatiles produced by the same Q. lyrata-samples for non-inoculated (D), partially decayed (E), and pure culture (F), respectively.
Figure 2.
Figure 2.
LibraNose 2.1 e-nose sensor-array output derived from Ganoderma lucidum-decayed Celtis australis wood block one year after artificial inoculation. Three replication analyses were performed per sample during a 2,400 s run cycle. Notice that there is a complete reversal of sorption of volatiles to the sensors as indicated by frequency shifts at three separate instances during the run.
Figure 3.
Figure 3.
Aroma map plot showing discrimination of volatiles from healthy control wood blocks (yellow labels) and volatiles from artificially-inoculated decayed wood block (red labels) using principal component analysis (PCA) of mean changes (shifts) in quartz crystal oscillation frequency (Δf) in response to differences in VOC mixture composition in headspace volatiles from different sample types.
Figure 4.
Figure 4.
Aroma map plot showing discrimination of volatiles from decayed wood samples of (A) Celtis australis, (B) Tilia spp. and (C) Acer negundo by principal component analysis (PCA) of mean changes in crystal oscillation-frequency (Δf) data. Different color labels indicate different wood decay fungi responsible for decay and corresponding headspace volatiles produced. The first two letters of each label indicate specific tree species according to the following abbreviations: ca = Celtis australis; tx = Tilia sp.; an = Acer negundo. The subsequent letters following in the label indicate the wood decay fungus responsible for decaying the wood blocks for 12 months following artificial inoculation: ganluc = Ganoderma lucidum: hetann = Heterobasidion annosum; armmell = Armillaria mellea; armost = A. ostoyae; inodry = Inonotus dryadeus. Con = undecayed or healthy (control) wood blocks.
Figure 4.
Figure 4.
Aroma map plot showing discrimination of volatiles from decayed wood samples of (A) Celtis australis, (B) Tilia spp. and (C) Acer negundo by principal component analysis (PCA) of mean changes in crystal oscillation-frequency (Δf) data. Different color labels indicate different wood decay fungi responsible for decay and corresponding headspace volatiles produced. The first two letters of each label indicate specific tree species according to the following abbreviations: ca = Celtis australis; tx = Tilia sp.; an = Acer negundo. The subsequent letters following in the label indicate the wood decay fungus responsible for decaying the wood blocks for 12 months following artificial inoculation: ganluc = Ganoderma lucidum: hetann = Heterobasidion annosum; armmell = Armillaria mellea; armost = A. ostoyae; inodry = Inonotus dryadeus. Con = undecayed or healthy (control) wood blocks.
Figure 5.
Figure 5.
Typical sensor-response outputs from representative samples of healthy wood blocks (controls), and inoculated wood blocks (decayed). Sensory array output from: (A) a non-inoculated sample of Acer saccharinum, (B) and a decayed wood sample of A. saccharinum after inoculation with Armillaria mellea. Histograms of normalized intensity responses of individual sensors to headspace volatiles produced by the same Q. lyrata-samples for non-inoculated (C), and decayed wood (D), respectively. G/G0 is the ratio of the conductivity response of the sensors to the sample gas (G) relative to the carrier gas (G0) over time. The following data were adjusted relative to the carrier gas baseline.
Figure 5.
Figure 5.
Typical sensor-response outputs from representative samples of healthy wood blocks (controls), and inoculated wood blocks (decayed). Sensory array output from: (A) a non-inoculated sample of Acer saccharinum, (B) and a decayed wood sample of A. saccharinum after inoculation with Armillaria mellea. Histograms of normalized intensity responses of individual sensors to headspace volatiles produced by the same Q. lyrata-samples for non-inoculated (C), and decayed wood (D), respectively. G/G0 is the ratio of the conductivity response of the sensors to the sample gas (G) relative to the carrier gas (G0) over time. The following data were adjusted relative to the carrier gas baseline.
Figure 6.
Figure 6.
Discrimination of healthy (controls) and decayed (artificially inoculated) wood blocks samples by PCA based on differences in analyte principal components within headspace volatiles relative to standard deviations from the mean (Δσ). Color-coded labels are as follows: Green labels indicate volatiles from healthy, undecayed controls and blue labels indicate volatiles from decayed wood samples.
Figure 7.
Figure 7.
Aroma map plots based on LDA of volatiles from healthy and decayed wood blocks of (A) Acer negundo, (B) Acer saccharinum, (C) Castanea sativa, (D) Cedrus deodara, (E) Celtis australis, (F) Platanus x acerifolia, (G) Quercus rubra and (H) Robinia pseudoacacia after 12 months of decay by five different wood decay fungi defined by two principal components. Color codes for decay treatments, based on the wood decay fungus responsible for decay, are as follows: undecayed healthy wood (red); wood decayed by Armillaria mellea (green); wood decayed by Ganoderma lucidum (cyan); wood decayed by Armillaria ostoyae (dark blue); wood decayed by Heterobasidion annosum (olive); and wood decayed by Inonotus dryadeus (gray).
Figure 7.
Figure 7.
Aroma map plots based on LDA of volatiles from healthy and decayed wood blocks of (A) Acer negundo, (B) Acer saccharinum, (C) Castanea sativa, (D) Cedrus deodara, (E) Celtis australis, (F) Platanus x acerifolia, (G) Quercus rubra and (H) Robinia pseudoacacia after 12 months of decay by five different wood decay fungi defined by two principal components. Color codes for decay treatments, based on the wood decay fungus responsible for decay, are as follows: undecayed healthy wood (red); wood decayed by Armillaria mellea (green); wood decayed by Ganoderma lucidum (cyan); wood decayed by Armillaria ostoyae (dark blue); wood decayed by Heterobasidion annosum (olive); and wood decayed by Inonotus dryadeus (gray).

References

    1. Smiley E.T., Fraedrich B.R., Fengler P. Hazard tree inspection, evaluation, and management. In: Kuser J., editor. Urban and Community Forestry in the Northeast. Kluwer Academic/Plenum; New York, NY, USA: 2007. pp. 277–294.
    1. Rayner A.D.M., Boddy L. Fungal decomposition of Wood: Its Biology and Ecology. Wiley; Chichester, UK: 1988.
    1. Mattheck C., Breloer H. Field guide for visual tree assessment. Arboric. J. 1994;18:1–23.
    1. Wilson A.D., Lester D.G., Oberle C.S. Development of conductive polymer analysis for the rapid detection and identification of phytopathogenic microbes. Phytopathology. 2004;94:419–431. - PubMed
    1. Korpi A., Kasanen J.P., Alarie Y., Kosma V.M., Pasanen A.L. Sensory irritating potency of some microbial volatile organic compounds (MVOCs) and a mixture of five MVOCs. Arch. Environ. Health. 1999;54:347–352. - PubMed

Publication types

MeSH terms

Substances