

Using fuzzy logic to enhance stereo matching in multiresolution images
- PMID: 22205859
- PMCID: PMC3244005
- DOI: 10.3390/100201093
Using fuzzy logic to enhance stereo matching in multiresolution images
Abstract
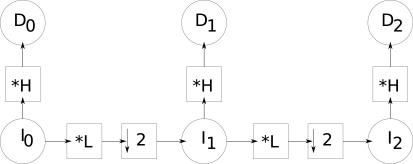
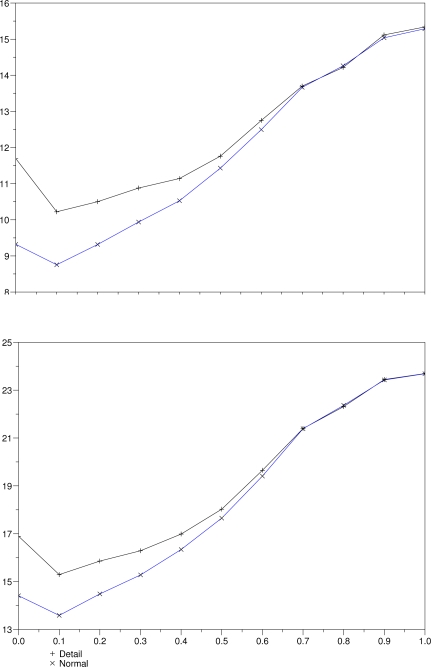
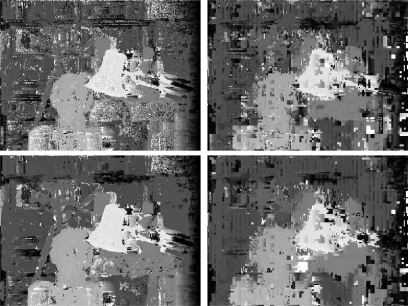
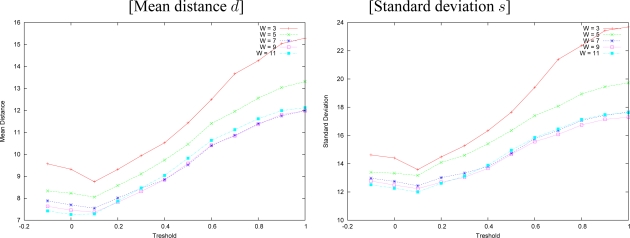
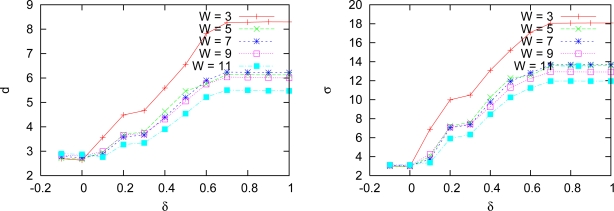
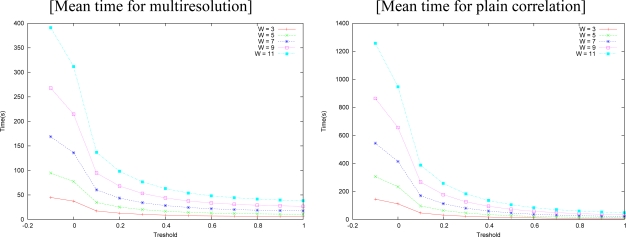
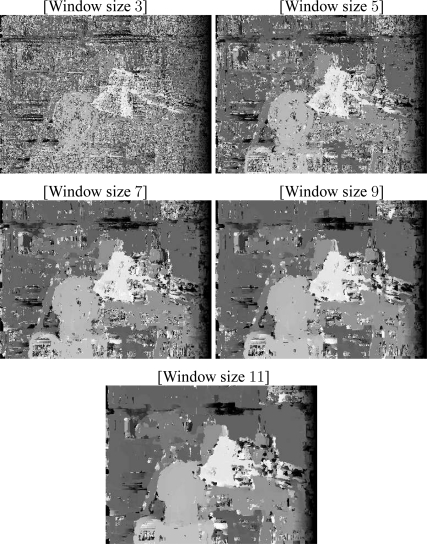
Stereo matching is an open problem in computer vision, for which local features are extracted to identify corresponding points in pairs of images. The results are heavily dependent on the initial steps. We apply image decomposition in multiresolution levels, for reducing the search space, computational time, and errors. We propose a solution to the problem of how deep (coarse) should the stereo measures start, trading between error minimization and time consumption, by starting stereo calculation at varying resolution levels, for each pixel, according to fuzzy decisions. Our heuristic enhances the overall execution time since it only employs deeper resolution levels when strictly necessary. It also reduces errors because it measures similarity between windows with enough details. We also compare our algorithm with a very fast multi-resolution approach, and one based on fuzzy logic. Our algorithm performs faster and/or better than all those approaches, becoming, thus, a good candidate for robotic vision applications. We also discuss the system architecture that efficiently implements our solution.
Keywords: fuzzy rules; image analysis; multiresolution; sensor configuration; stereo matching; vision.
Figures


Similar articles
-
Fuzzy Medical Computer Vision Image Restoration and Visual Application.Comput Math Methods Med. 2022 Jun 21;2022:6454550. doi: 10.1155/2022/6454550. eCollection 2022. Comput Math Methods Med. 2022. PMID: 35774301 Free PMC article.
-
Visual odometry based on structural matching of local invariant features using stereo camera sensor.Sensors (Basel). 2011;11(7):7262-84. doi: 10.3390/s110707262. Epub 2011 Jul 18. Sensors (Basel). 2011. PMID: 22164016 Free PMC article.
-
[Fuzzy space based segmentation algorithm on periosteum medical image processing].Sheng Wu Yi Xue Gong Cheng Xue Za Zhi. 2000 Jun;17(2):170-3. Sheng Wu Yi Xue Gong Cheng Xue Za Zhi. 2000. PMID: 12557773 Chinese.
-
A Review on the Rule-Based Filtering Structure with Applications on Computational Biomedical Images.J Healthc Eng. 2022 Mar 8;2022:2599256. doi: 10.1155/2022/2599256. eCollection 2022. J Healthc Eng. 2022. PMID: 35299677 Free PMC article. Review.
-
[Edge-detection and its application in medical image processing].Sheng Wu Yi Xue Gong Cheng Xue Za Zhi. 2001 Mar;18(1):149-53. Sheng Wu Yi Xue Gong Cheng Xue Za Zhi. 2001. PMID: 11332098 Review. Chinese.
References
-
- Horn B.K.P. Robot Vision. The MIT Press; Cambridge, MA, USA: 1986.
-
- Marr D. Vision — A Computational Investigation into the Human Representation and Processing of Visual Information. The MIT Press; Cambridge, MA, USA: 1982.
-
- Lotti J.L., Giraudon G. Correlation algorithm with adaptive window for aerial image in stereo vision. In: Desachy J., editor. Image and Signal Processing for Remote Sensing. Vol. 2315. SPIE; Bellingham, WA, USA: 1994. pp. 76–87.
-
- Hespanha J., Dods Z., Hagger G., Morse A. Decidability of robot positioning tasks using stereo vision system. Proceedings of the 37th IEEE Conference on Decision and Control; Tampa, FL, USA. December 16–18, 1998; pp. 1–6.
-
- Hubber E., Kortenkamp D. Using stereo vision to pursue moving agents with a mobile robot. Proceedings of the 1995 IEEE International Conference on Robotics and Automation; Nagoya, Japan. May 21–27, 1995; pp. 2340–234.
Publication types
MeSH terms
LinkOut - more resources
Full Text Sources
