. 2011 Dec;9(12):e1001221.
doi: 10.1371/journal.pbio.1001221. Epub 2011 Dec 20.

Recognition and degradation of plant cell wall polysaccharides by two human gut symbionts

Affiliations

Recognition and degradation of plant cell wall polysaccharides by two human gut symbionts

Eric C Martens et al. PLoS Biol. 2011 Dec.

Abstract

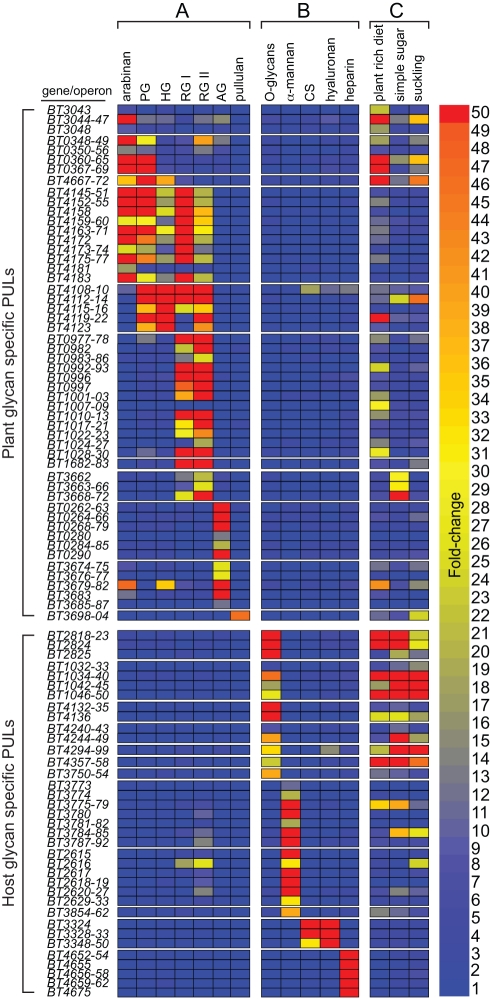
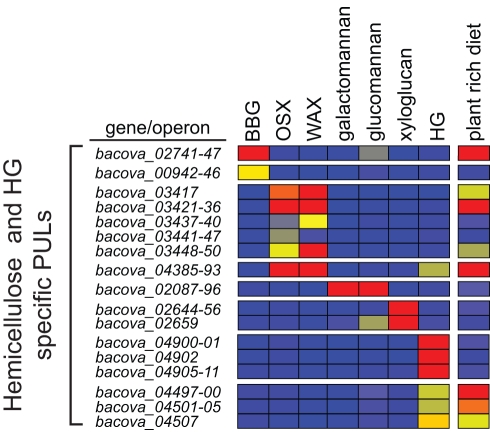
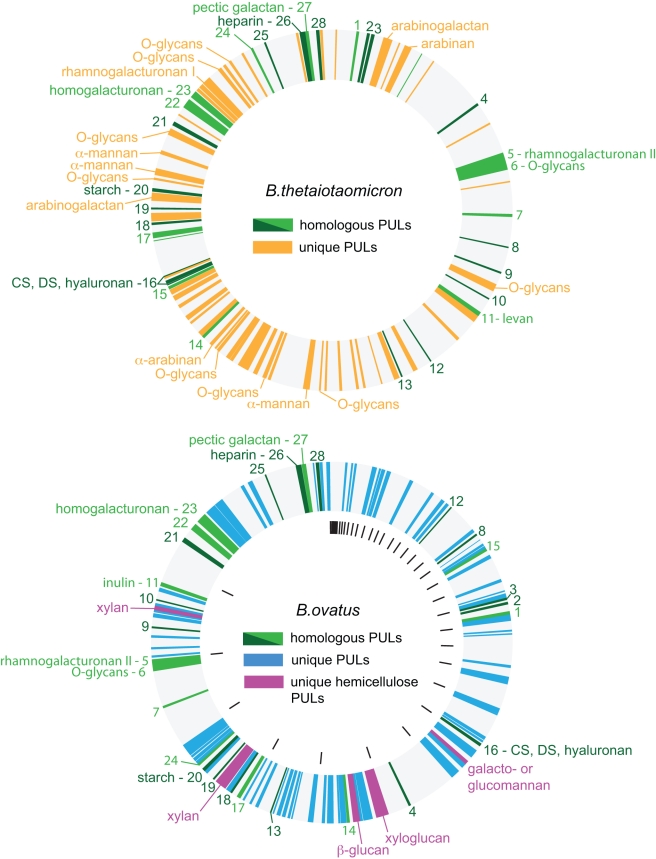
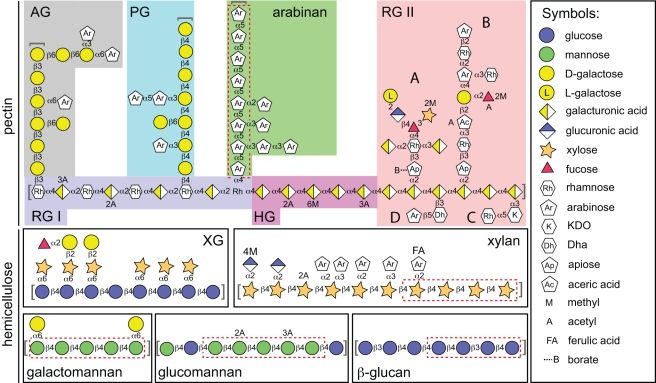
Symbiotic bacteria inhabiting the human gut have evolved under intense pressure to utilize complex carbohydrates, primarily plant cell wall glycans in our diets. These polysaccharides are not digested by human enzymes, but are processed to absorbable short chain fatty acids by gut bacteria. The Bacteroidetes, one of two dominant bacterial phyla in the adult gut, possess broad glycan-degrading abilities. These species use a series of membrane protein complexes, termed Sus-like systems, for catabolism of many complex carbohydrates. However, the role of these systems in degrading the chemically diverse repertoire of plant cell wall glycans remains unknown. Here we show that two closely related human gut Bacteroides, B. thetaiotaomicron and B. ovatus, are capable of utilizing nearly all of the major plant and host glycans, including rhamnogalacturonan II, a highly complex polymer thought to be recalcitrant to microbial degradation. Transcriptional profiling and gene inactivation experiments revealed the identity and specificity of the polysaccharide utilization loci (PULs) that encode individual Sus-like systems that target various plant polysaccharides. Comparative genomic analysis indicated that B. ovatus possesses several unique PULs that enable degradation of hemicellulosic polysaccharides, a phenotype absent from B. thetaiotaomicron. In contrast, the B. thetaiotaomicron genome has been shaped by increased numbers of PULs involved in metabolism of host mucin O-glycans, a phenotype that is undetectable in B. ovatus. Binding studies of the purified sensor domains of PUL-associated hybrid two-component systems in conjunction with transcriptional analyses demonstrate that complex oligosaccharides provide the regulatory cues that induce PUL activation and that each PUL is highly specific for a defined cell wall polymer. These results provide a view of how these species have diverged into different carbohydrate niches by evolving genes that target unique suites of available polysaccharides, a theme that likely applies to disparate bacteria from the gut and other habitats.


Conflict of interest statement

The authors have declared that no competing interests exist.

Figures

Figure 1
Figure 1. B. thetaiotaomicron PULs expressed in response to plant and host glycans.
Heatmap showing PUL operon induction by various plant and host glycans. Each box represents the average fold-change (relative to MM-G) of all genes within the indicated operon (gene numbers listed at left) and is calibrated according to the vertical bar at the extreme right. Individual PULs are separated by horizontal breaks in the heat map. Growth conditions have been divided into three categories: column A, growth on plant cell wall pectins and the starch-like molecule pullulan; column B, growth on different forms of host glycans or α-mannan (a proxy for the mannose rich core region of N-glycans); column C, growth in vivo in adult mono-associated NMRI mice fed a “plant rich diet” or a “simple sugar” diet, or neonatal mice that are still suckling on mother's milk (“suckling”). A Venn diagram illustration of total gene changes in these conditions is provided in Figure S3. PG, pectic galactan; HG, homogalacturonan; RG I, rhamnogalacturonan I; RG II, rhamnogalacturonan II; AG, arabinogalactan; CS, chondroitin sulfate.
Figure 2
Figure 2. B. ovatus PULs expressed in response to plant cell wall glycans.
A heatmap showing PUL operon induction by various hemicelluloses and homogalacturonan. Data analysis is identical to that described for B. thetaiotaomicron in Figure 1, including comparison to a MM-G reference and use of a ≥10-fold cutoff. The rightmost column in the heatmap shows the responses of PULs in the ceca of mice fed the same plant-rich diet used for B. thetaiotoamicron. Heatmap values are calibrated according to the bar shown in Figure 1. A Venn diagram illustration of total gene changes in these conditions is provided in Figure S6. BBG, barley β-glucan; OSX, oat spelt xylan; WAX, wheat arabinoxylan; HG, homogalacturonan.
Figure 3
Figure 3. Comparisons of PULs in the sequenced type strain genomes of B. thetaiotaomicron and B. ovatus.
The arrangement of PULs in the genome of each species is illustrated as a circular map with genes color coded as follows: “homologous PULs” (dark green); “probably homologous PULs” (light green); B. thetaiotaomicron-specific PULs (gold); B. ovatus specific PULs (light blue), B. ovatus-specific hemicellulose PULs (pink); all other genes in each species (gray). Shared PULs are labeled 1 through 28 based on their order in the B. thetaiotaomicron genome (clockwise from the top). Contigs in the deep-draft B. ovatus genome assembly are arranged in order of increasing size (clockwise from the top). Gaps in the genome assembly are illustrated as black tick marks around the interior of the B. ovatus genome. Empirically measured in vitro substrate specificities for some PULs are labeled around each genome schematic and correspond to PULs that were induced ≥10-fold in response to the indicated glycan class in this or previous studies ,. Homologous B. ovatus PULs that correspond to a B. thetaiotaomicron locus with known substrate response are also labeled with that substrate name. CS, chondroitin sulfate; DS, dermatan sulfate.
Figure 4
Figure 4. Schematic of the structures of plant cell wall pectins and hemicelluloses.
Various representative glycan structures presented to B. thetaiotaomicron and B. ovatus in this study. The dashed red lines show the identity of the oligosaccharide signal molecules that preferentially activate PUL expression. The key to the abbreviated polysaccharides is provided in the legends to Figures 1 and 2. Brackets at the end(s) of glycan chains indicate that the actual glycan structure can be longer than that which is illustrated. Definitions of symbols used are provided in the key at the right. Note that the structures drawn are representative of predominant linkages and monosaccharides contained in each of the glycans. However, the illustrated glycans do not represent exact structures and many permutations are possible that vary in terms of chain length, methyl or acetyl substitution, or branch configurations, depending upon the species or tissue of origin, and/or the state of cellular differentiation.
Figure 5
Figure 5. Plant glycan PULs are specifically activated by signature oligosaccharides that define their target polysaccharide.
Cells were grown on MM supplemented with polysaccharide, oligosaccharide, or glucose as the sole carbon source, and levels of different susC transcripts in each condition were quantified by qPCR. The susC genes chosen as markers for expression of their cognate PUL were identified from the GeneChip data. Panels (A) and (E) are B. thetaiotaomicron. Panels (B–D) are B. ovatus. The y-axis shows the fold-change relative to a MM-G reference; x-axis labels indicate the locus tag of the susC gene probed in each condition. Data are averages and standard deviations of three biological replicates.

Comment in

  • How bacteria turn fiber into food.
    Inman M. Inman M. PLoS Biol. 2011 Dec;9(12):e1001227. doi: 10.1371/journal.pbio.1001227. Epub 2011 Dec 20. PLoS Biol. 2011. PMID: 22205880 Free PMC article. No abstract available.

References

    1. Flint H. J, Bayer E. A, Rincon M. T, Lamed R, White B. A. Polysaccharide utilization by gut bacteria: potential for new insights from genomic analysis. Nat Rev Microbiol. 2008;6:121–131. - PubMed
    1. McNeil N. I. The contribution of the large intestine to energy supplies in man. Am J Clin Nutr. 1984;39:338–342. - PubMed
    1. Eckburg P. B, Bik E. M, Bernstein C. N, Purdom E, Dethlefsen L, et al. Diversity of the human intestinal microbial flora. Science. 2005;308:1635–1638. - PMC - PubMed
    1. Ley R. E, Hamady M, Lozupone C, Turnbaugh P. J, Ramey R. R, et al. Evolution of mammals and their gut microbes. Science. 2008;320:1647–1651. - PMC - PubMed
    1. Qin J, Li R, Raes J, Arumugam M, Burgdorf K. S, et al. A human gut microbial gene catalogue established by metagenomic sequencing. Nature. 2010;464:59–65. - PMC - PubMed

Publication types