

Multi-cellular logistics of collective cell migration
- PMID: 22205934
- PMCID: PMC3244380
- DOI: 10.1371/journal.pone.0027950
Multi-cellular logistics of collective cell migration
Abstract
During development, the formation of biological networks (such as organs and neuronal networks) is controlled by multicellular transportation phenomena based on cell migration. In multi-cellular systems, cellular locomotion is restricted by physical interactions with other cells in a crowded space, similar to passengers pushing others out of their way on a packed train. The motion of individual cells is intrinsically stochastic and may be viewed as a type of random walk. However, this walk takes place in a noisy environment because the cell interacts with its randomly moving neighbors. Despite this randomness and complexity, development is highly orchestrated and precisely regulated, following genetic (and even epigenetic) blueprints. Although individual cell migration has long been studied, the manner in which stochasticity affects multi-cellular transportation within the precisely controlled process of development remains largely unknown. To explore the general principles underlying multicellular migration, we focus on the migration of neural crest cells, which migrate collectively and form streams. We introduce a mechanical model of multi-cellular migration. Simulations based on the model show that the migration mode depends on the relative strengths of the noise from migratory and non-migratory cells. Strong noise from migratory cells and weak noise from surrounding cells causes "collective migration," whereas strong noise from non-migratory cells causes "dispersive migration." Moreover, our theoretical analyses reveal that migratory cells attract each other over long distances, even without direct mechanical contacts. This effective interaction depends on the stochasticity of the migratory and non-migratory cells. On the basis of these findings, we propose that stochastic behavior at the single-cell level works effectively and precisely to achieve collective migration in multi-cellular systems.
Conflict of interest statement
Figures

 and
and  ) is proportional to the degree of overlap, as indicated by the red arrow. (B) The migrating cell (indicated by a gray circle) is assumed to be attracted by a chemo-attractant gradient. Its driving force (the sum of
  and
and  ) is generated at points of contact with other cells, whereas reactive forces (
 and
and  ) are applied in the direction opposite to that of the attractant gradient regardless of the cell type (migratory or non-migratory). (C) The repulsive forces when the cells contact and the attractive adhesive forces when the cells are close are given by the gradient of the potential
  . The black and dashed red lines indicate the potential
  for Equations (1) and (8), respectively. The black arrow indicates a steady-state point at which the two cells just contact.
 ) distributed as a cluster (upper panel) and then migrate rightward progressively at
  (the lower three panels). The fluctuation intensities for the migratory and non-migratory cells are set to
  and
and  , respectively.
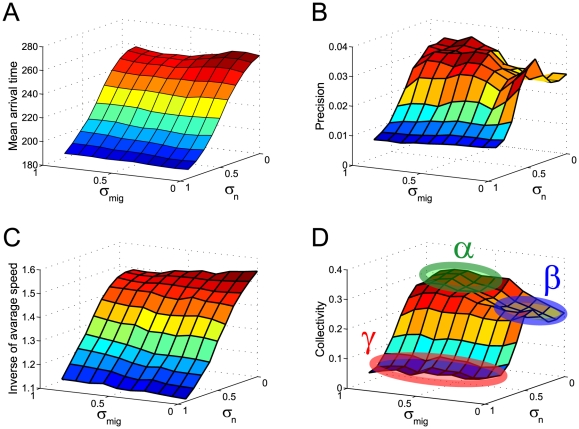
 (A) and the inverse of the variance in the position of the migratory cell after arriving at the position (B) are plotted. The inverses of the mean velocity (C) and collectivity (D) of the migratory cells are plotted at a quasi-steady state after the initial transient phase. Here, collectivity is defined by Equation (6), with
  and
and  . In (D), there are three typical collectivity patterns, signified by
  ,
,  , and
, and  .
.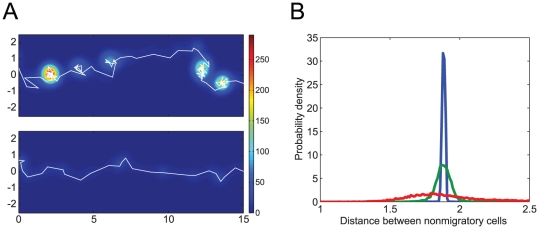
 and
and  in Figure 3D. The color contour indicates the density of the migratory cells as calculated by the kernel density estimation using Gaussian kernel functions. (B) Each line shows the distribution of distances between neighboring non-migratory cells when simulating a multi-cellular system that has only non-migratory cells and no migratory cell. The green, blue, and red lines correspond to the cases that have parameter values in the three regions,
  ,
,  , and
, and  in Figure 3D.
 ,
,  , and
, and  in Figure 3D. (A) The migration patterns at a specific point in time are shown. The white and black circles indicate migratory and non-migratory cells, respectively. (B) The cell contacts are shown at the same time point as in (A). The links depict contacts between cells that interact by repulsive elastic forces (Figure 1A), the strengths of which are indicated by their brightness (for red), or darkness (for blue).

 ,
,  , and
, and  in Figure 3D, respectively. The
  and
and  axes indicate spatial coordinates relative to a migratory cell in Figures 6A and C. (A-C) The average cellular density is estimated by the same method as in Figure 6B. The potential landscape (D-F) and effective noise intensity along the
  axis (G-I) are estimated using a least-square regression for polynomial functions. Please see the Materials and Methods section.
 ,
,  , and
, and  in Figure 3D, respectively. The average migratory cell speeds are plotted according to various values for population size (A), migratory cells radius (B, C), migration driving force (D), and Young's modulus for all cells (E). In (F), an additional attractive force from cell adhesion is included in the model by using Equation (8) (see also the text) instead of Equation (1), and its intensity
  is varied. In (A), (C), (D), (E), and (F), the setting of the migratory and non-migratory cells is similar to that in Figure 2, with the addition of the attractive force in (F), whereas in (B), there is only a single migratory cell surrounded by non-migratory cells.
 ) doubled. (B) Chain- or cluster-like migration was induced by introducing an attractive force due to cellular adhesion, i.e., Equation (9). The attractive force intensity is
  , the effective distance of the attractive force is
  , and the other parameter values are those of the characteristic point
  in Figure 3D.
References
Publication types
MeSH terms
LinkOut - more resources
Full Text Sources
