

Systematic drug repositioning based on clinical side-effects
- PMID: 22205936
- PMCID: PMC3244383
- DOI: 10.1371/journal.pone.0028025
Systematic drug repositioning based on clinical side-effects
Abstract
Drug repositioning helps fully explore indications for marketed drugs and clinical candidates. Here we show that the clinical side-effects (SEs) provide a human phenotypic profile for the drug, and this profile can suggest additional disease indications. We extracted 3,175 SE-disease relationships by combining the SE-drug relationships from drug labels and the drug-disease relationships from PharmGKB. Many relationships provide explicit repositioning hypotheses, such as drugs causing hypoglycemia are potential candidates for diabetes. We built Naïve Bayes models to predict indications for 145 diseases using the SEs as features. The AUC was above 0.8 in 92% of these models. The method was extended to predict indications for clinical compounds, 36% of the models achieved AUC above 0.7. This suggests that closer attention should be paid to the SEs observed in trials not just to evaluate the harmful effects, but also to rationally explore the repositioning potential based on this "clinical phenotypic assay".
Conflict of interest statement
Figures
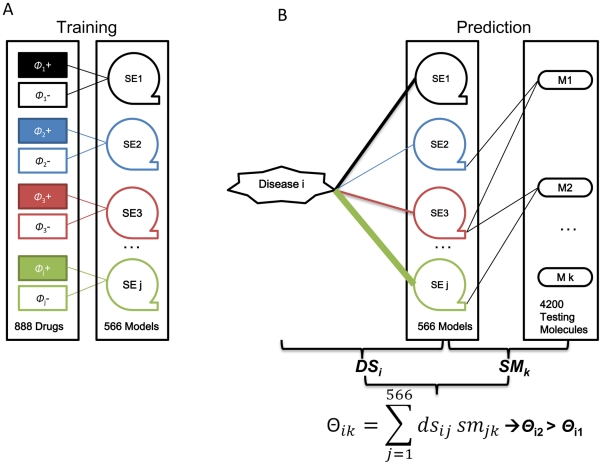
 (+) and
  (−) were recruited from 888 SIDER molecules. b) The diseasei-moleculek association (Θik) was calculated as the dot product value of the disease-SE association vector (DS) and SE-molecule association vector (SM). The binary SE-molecule (SM) association was calculated from QSAR models. The width of the colored lines indicates the weights of the disease-SE associations. As an example, Θi2 is more than Θi1 as the association of side effect j in green to disease i is stronger.
Similar articles
-
PISTON: Predicting drug indications and side effects using topic modeling and natural language processing.J Biomed Inform. 2018 Nov;87:96-107. doi: 10.1016/j.jbi.2018.09.015. Epub 2018 Sep 27. J Biomed Inform. 2018. PMID: 30268842
-
Exploring the relationship between drug side-effects and therapeutic indications.AMIA Annu Symp Proc. 2013 Nov 16;2013:1568-77. eCollection 2013. AMIA Annu Symp Proc. 2013. PMID: 24551427 Free PMC article.
-
Combining automatic table classification and relationship extraction in extracting anticancer drug-side effect pairs from full-text articles.J Biomed Inform. 2015 Feb;53:128-35. doi: 10.1016/j.jbi.2014.10.002. Epub 2014 Oct 13. J Biomed Inform. 2015. PMID: 25445920 Free PMC article.
-
Exploiting drug-disease relationships for computational drug repositioning.Brief Bioinform. 2011 Jul;12(4):303-11. doi: 10.1093/bib/bbr013. Epub 2011 Jun 20. Brief Bioinform. 2011. PMID: 21690101 Free PMC article. Review.
-
A review of network-based approaches to drug repositioning.Brief Bioinform. 2018 Sep 28;19(5):878-892. doi: 10.1093/bib/bbx017. Brief Bioinform. 2018. PMID: 28334136 Review.
Cited by
-
Construction of drug network based on side effects and its application for drug repositioning.PLoS One. 2014 Feb 4;9(2):e87864. doi: 10.1371/journal.pone.0087864. eCollection 2014. PLoS One. 2014. PMID: 24505324 Free PMC article.
-
A Proteotranscriptomic-Based Computational Drug-Repositioning Method for Alzheimer's Disease.Front Pharmacol. 2020 Jan 29;10:1653. doi: 10.3389/fphar.2019.01653. eCollection 2019. Front Pharmacol. 2020. PMID: 32063857 Free PMC article.
-
Integrating Clinical Phenotype and Gene Expression Data to Prioritize Novel Drug Uses.CPT Pharmacometrics Syst Pharmacol. 2016 Nov;5(11):599-607. doi: 10.1002/psp4.12108. Epub 2016 Nov 14. CPT Pharmacometrics Syst Pharmacol. 2016. PMID: 27860440 Free PMC article.
-
Drug repositioning for non-small cell lung cancer by using machine learning algorithms and topological graph theory.BMC Bioinformatics. 2016 Jan 11;17 Suppl 1(Suppl 1):2. doi: 10.1186/s12859-015-0845-0. BMC Bioinformatics. 2016. PMID: 26817825 Free PMC article.
-
The assessment of efficient representation of drug features using deep learning for drug repositioning.BMC Bioinformatics. 2019 Nov 14;20(1):577. doi: 10.1186/s12859-019-3165-y. BMC Bioinformatics. 2019. PMID: 31726977 Free PMC article.
References
-
- Ashburn TT, Thor KB. Drug repositioning: identifying and developing new uses for existing drugs. Nat Rev Drug Discov. 2004;3:673–683. - PubMed
-
- Sardana D, Zhu C, Zhang M, Gudivada RC, Yang L, et al. Drug repositioning for orphan diseases. Brief Bioinform 2011 - PubMed
-
- Campillos M, Kuhn M, Gavin AC, Jensen LJ, Bork P. Drug target identification using side-effect similarity. Science. 2008;321:263–266. - PubMed
MeSH terms
LinkOut - more resources
Full Text Sources
Other Literature Sources
Medical
