The influence of feature selection methods on accuracy, stability and interpretability of molecular signatures
- PMID: 22205940
- PMCID: PMC3244389
- DOI: 10.1371/journal.pone.0028210
The influence of feature selection methods on accuracy, stability and interpretability of molecular signatures
Abstract
Biomarker discovery from high-dimensional data is a crucial problem with enormous applications in biology and medicine. It is also extremely challenging from a statistical viewpoint, but surprisingly few studies have investigated the relative strengths and weaknesses of the plethora of existing feature selection methods. In this study we compare 32 feature selection methods on 4 public gene expression datasets for breast cancer prognosis, in terms of predictive performance, stability and functional interpretability of the signatures they produce. We observe that the feature selection method has a significant influence on the accuracy, stability and interpretability of signatures. Surprisingly, complex wrapper and embedded methods generally do not outperform simple univariate feature selection methods, and ensemble feature selection has generally no positive effect. Overall a simple Student's t-test seems to provide the best results.
Conflict of interest statement
Figures

 in a
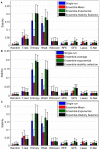
in a  -fold CV setting and averaged over the four datasets.
 -fold CV setting averaged over the four datasets.
 -fold CV setting. We show here the accuracy for 100-gene signatures as averaged over the
  datasets. Note that the maximum value of the x axis is constrained by the smallest dataset, namely GSE2990.
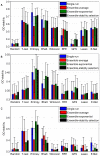
 -fold CV setting for each of the four datasets. We show here the accuracy for 100-gene signatures.


 randomly chosen background genes.

References
-
- Sotiriou C, Pusztai L. Gene-expression signatures in breast cancer. N Engl J Med. 2009;360:790–800. - PubMed
-
- Ioannidis JPA. Microarrays and molecular research: noise discovery? Lancet. 2005;365:454. - PubMed
-
- Ein-Dor L, Kela I, Getz G, Givol D, Domany E. Outcome signature genes in breast cancer: is there a unique set? Bioinformatics. 2005;21:171–178. - PubMed
-
- Michiels S, Koscielny S, Hill C. Prediction of cancer outcome with microarrays: a multiple random validation strategy. Lancet. 2005;365:488–492. - PubMed
Publication types
MeSH terms
Substances
LinkOut - more resources
Full Text Sources
Other Literature Sources

