

Temporal integration of movement: the time-course of motion streaks revealed by masking
- PMID: 22205961
- PMCID: PMC3243686
- DOI: 10.1371/journal.pone.0028675
Temporal integration of movement: the time-course of motion streaks revealed by masking
Abstract
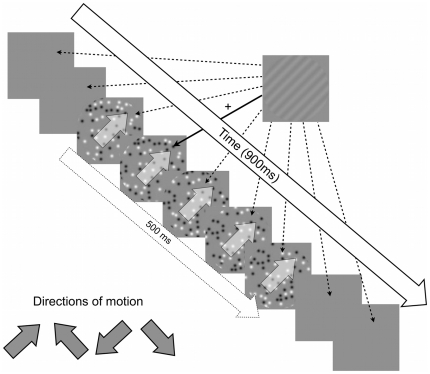
Temporal integration in the visual system causes fast-moving objects to leave oriented 'motion streaks' in their wake, which could be used to facilitate motion direction perception. Temporal integration is thought to occur over ≈100 ms in early cortex, although this has never been tested for motion streaks. Here we compare the ability of fast-moving ('streaky') and slow-moving fields of dots to mask briefly flashed gratings either parallel or orthogonal to the motion trajectory. Gratings were presented at various asynchronies relative to motion onset (from -200 to +700 ms) to sample the time-course of the accumulating streaks. Predictions were that masking would be strongest for the fast parallel condition, and would be weak at early asynchronies and strengthen over time as integration rendered the translating dots more streaky and grating-like. The asynchrony where the masking function reached a plateau would correspond to the temporal integration period. As expected, fast-moving dots caused greater masking of parallel gratings than orthogonal gratings, and slow motion produced only modest masking of either grating orientation. Masking strength in the fast, parallel condition increased with time and reached a plateau after 77 ms, providing an estimate of the temporal integration period for mechanisms encoding motion streaks. Interestingly, the greater masking by fast motion of parallel compared with orthogonal gratings first reached significance at 48 ms before motion onset, indicating an effect of backward masking by motion streaks.
Conflict of interest statement
Figures
 to
to  ms relative to motion onset, were randomly interleaved in blocks of trials.
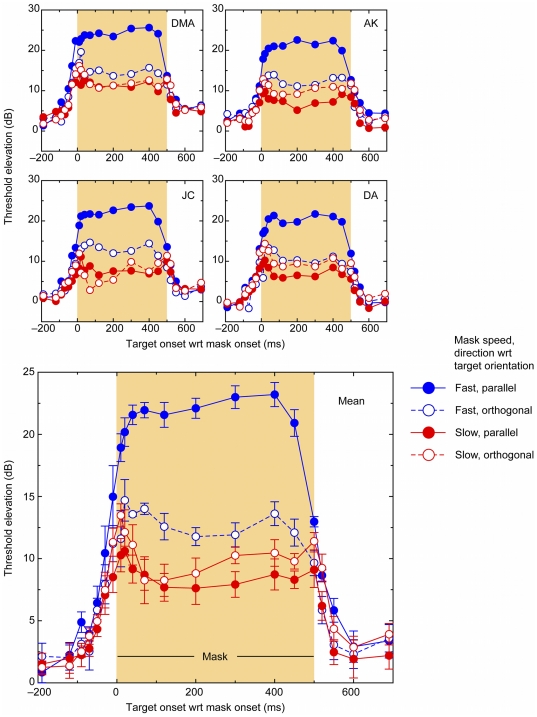
 1 standard error bars. To capture any effects of backward and forward masking, target gratings were presented as early as 190 ms before the motion mask began (indicated by negative timing), as well as up to 190 ms after the motion mask ended. Results are shown for fast and slow motion masks, and for target gratings parallel and orthogonal to the motion direction.
 1 standard error.
 and
and  ms, indicating a temporal integration period of 77 ms.
 – the values Manahilov et al found best described sustained impulse responses at a frequency of 2 cyc/deg. At half-height, the impulse response has a full width of 41 ms. b) A single frame taken from the sequence of frames defining the fast translating blobs. c) The temporally smeared version of the blob stimulus that results from passing the fast translating blob image in panel b through the temporal impulse shown in panel a (i.e., performing a convolution integral). The output shown in panel c is the ‘streaky’ image that can be assumed to emerge following a simple linear filtering stage characterized by a sustained impulse response. d) The spatial tuning of the streak image in panel c. The figure shows the output of a sliding log Gabor filter computing the spatial energy at each spatial frequency from the minimum frequency to 12 cyc/deg in the direction orthogonal to the streaky elongations (i.e., vertically, in this case). The log Gabor had a spatial bandwidth of 1 octave and a narrow orientation bandwidth (1
 ) oriented to sample vertically across the image shown in panel c. The peak frequency occurs at 1.6 cyc/deg and falls to half-height at 3.3 cyc/deg. e) The orientation tuning of the image in panel c at peak frequency. The data were obtained by rotating the log Gabor filter (1 octave spatial bandwidth, peak at 1.6 cyc/deg) in one-degree steps. Grey symbols show the filter output and the black line is the best-fitting Gaussian function (standard deviation = 22.2
 ).
).Similar articles
-
The spatial tuning of "motion streak" mechanisms revealed by masking and adaptation.J Vis. 2011 Jun 23;11(7):17. doi: 10.1167/11.7.17. J Vis. 2011. PMID: 21700953
-
Orientation tuning of contrast masking caused by motion streaks.J Vis. 2010 Aug 1;10(10):11. doi: 10.1167/10.10.11. J Vis. 2010. PMID: 20884476
-
Motion streaks in fast motion rivalry cause orientation-selective suppression.J Vis. 2009 May 14;9(5):10.1-14. doi: 10.1167/9.5.10. J Vis. 2009. PMID: 19757888
-
Direct evidence for encoding of motion streaks in human visual cortex.Proc Biol Sci. 2012 Dec 5;280(1752):20122339. doi: 10.1098/rspb.2012.2339. Print 2013 Feb 7. Proc Biol Sci. 2012. PMID: 23222445 Free PMC article.
-
The time course of visual backward masking deficits in schizophrenia.J Integr Neurosci. 2011 Mar;10(1):33-45. doi: 10.1142/S0219635211002609. J Integr Neurosci. 2011. PMID: 21425481 Review.
Cited by
-
Temporal Integration of Motion Streaks in Migraine.Vision (Basel). 2018 Jul 13;2(3):27. doi: 10.3390/vision2030027. Vision (Basel). 2018. PMID: 31735890 Free PMC article.
-
Investigating the Interaction Between Form and Motion Processing: A Review of Basic Research and Clinical Evidence.Front Psychol. 2020 Oct 30;11:566848. doi: 10.3389/fpsyg.2020.566848. eCollection 2020. Front Psychol. 2020. PMID: 33192845 Free PMC article. Review.
-
Interactions between motion and form processing in the human visual system.Front Comput Neurosci. 2013 May 20;7:65. doi: 10.3389/fncom.2013.00065. eCollection 2013. Front Comput Neurosci. 2013. PMID: 23730286 Free PMC article.
-
Temporal dynamics of mirror-symmetry perception.J Vis. 2018 May 1;18(5):10. doi: 10.1167/18.5.10. J Vis. 2018. PMID: 29904785 Free PMC article.
-
Breaking cover: neural responses to slow and fast camouflage-breaking motion.Proc Biol Sci. 2015 Aug 22;282(1813):20151182. doi: 10.1098/rspb.2015.1182. Proc Biol Sci. 2015. PMID: 26269500 Free PMC article.
References
-
- Burr D. Motion smear. Nature. 1980;284:164–165. - PubMed
-
- Graham C, Margaria R. Area and the intensity-time relation in the peripheral retina. American Journal of Physiology. 1935:299–305.
-
- Snowden R, Braddick O. The temporal integration and resolution of velocity signals. Vision Research. 1991;31:907–914. - PubMed
-
- Bloch AM. Expérience sur la vision. Comptes Rendus de Séances de la Sociétéde Biologie (Paris) 1885;27:493–495.
Publication types
MeSH terms
LinkOut - more resources
Full Text Sources
Research Materials
