

High-frequency dynamics of ocean pH: a multi-ecosystem comparison
- PMID: 22205986
- PMCID: PMC3242773
- DOI: 10.1371/journal.pone.0028983
High-frequency dynamics of ocean pH: a multi-ecosystem comparison
Abstract
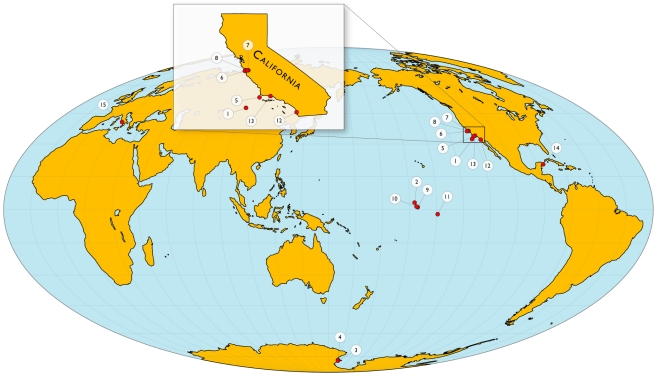
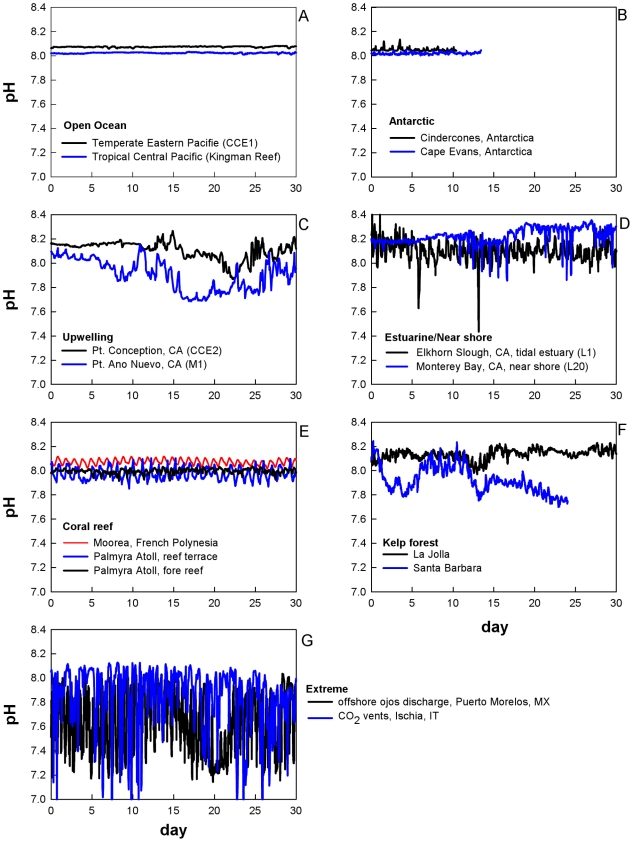
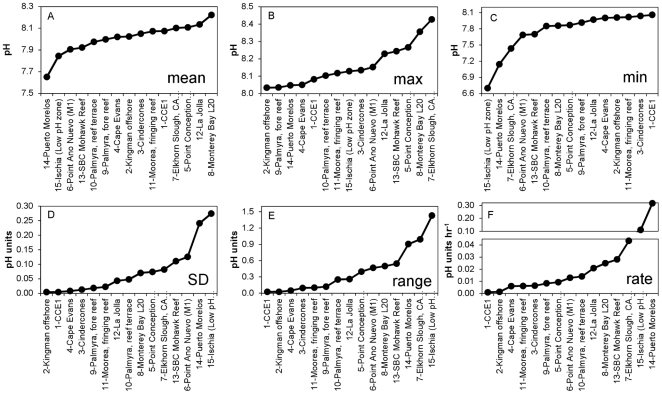
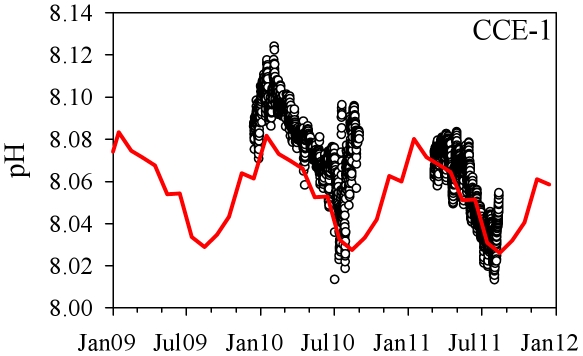
The effect of Ocean Acidification (OA) on marine biota is quasi-predictable at best. While perturbation studies, in the form of incubations under elevated pCO(2), reveal sensitivities and responses of individual species, one missing link in the OA story results from a chronic lack of pH data specific to a given species' natural habitat. Here, we present a compilation of continuous, high-resolution time series of upper ocean pH, collected using autonomous sensors, over a variety of ecosystems ranging from polar to tropical, open-ocean to coastal, kelp forest to coral reef. These observations reveal a continuum of month-long pH variability with standard deviations from 0.004 to 0.277 and ranges spanning 0.024 to 1.430 pH units. The nature of the observed variability was also highly site-dependent, with characteristic diel, semi-diurnal, and stochastic patterns of varying amplitudes. These biome-specific pH signatures disclose current levels of exposure to both high and low dissolved CO(2), often demonstrating that resident organisms are already experiencing pH regimes that are not predicted until 2100. Our data provide a first step toward crystallizing the biophysical link between environmental history of pH exposure and physiological resilience of marine organisms to fluctuations in seawater CO(2). Knowledge of this spatial and temporal variation in seawater chemistry allows us to improve the design of OA experiments: we can test organisms with a priori expectations of their tolerance guardrails, based on their natural range of exposure. Such hypothesis-testing will provide a deeper understanding of the effects of OA. Both intuitively simple to understand and powerfully informative, these and similar comparative time series can help guide management efforts to identify areas of marine habitat that can serve as refugia to acidification as well as areas that are particularly vulnerable to future ocean change.
Conflict of interest statement
Figures
References
-
- Kleypas JA, Feely RA, Fabry VJ, Langdon C, Sabine CL, et al. 2006. 88 Impacts of Ocean Acidification on Coral Reefs and Other Marine Calcifiers: A Guide for Future Research, report of a workshop held 18–20 April 2005, St. Petersberg, FL sponsored by NSF, NOAA, and U.S. Geological Survey.
-
- Royal Society. Ocean acidification due to increasing atmospheric carbon dioxide. London: Royal Society; 2005.
-
- Byrne M. Impact of ocean warming and ocean acidification on marine invertebrate life history stages: vulnerabilities and potential persistence in a changing ocean. Oceanogr Mar Biol. 2011;49:1–42.
-
- Doney SC, Fabry VJ, Feely RA, Kleypas JA. Ocean Acidification: The Other CO2 Problem. Annu Rev Mar Sci. 2009;1:169–192. - PubMed
-
- Fabry VJ, Seibel BA, Feely RA, Orr JC. Impacts of ocean acidification on marine fauna and ecosystem processes. ICES J Mar Sci. 2008;65:414–432.
Publication types
MeSH terms
LinkOut - more resources
Full Text Sources
Other Literature Sources
