Identifying priority areas for conservation: a global assessment for forest-dependent birds
- PMID: 22205998
- PMCID: PMC3242781
- DOI: 10.1371/journal.pone.0029080
Identifying priority areas for conservation: a global assessment for forest-dependent birds
Abstract
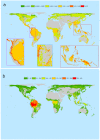
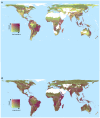
Limited resources are available to address the world's growing environmental problems, requiring conservationists to identify priority sites for action. Using new distribution maps for all of the world's forest-dependent birds (60.6% of all bird species), we quantify the contribution of remaining forest to conserving global avian biodiversity. For each of the world's partly or wholly forested 5-km cells, we estimated an impact score of its contribution to the distribution of all the forest bird species estimated to occur within it, and so is proportional to the impact on the conservation status of the world's forest-dependent birds were the forest it contains lost. The distribution of scores was highly skewed, a very small proportion of cells having scores several orders of magnitude above the global mean. Ecoregions containing the highest values of this score included relatively species-poor islands such as Hawaii and Palau, the relatively species-rich islands of Indonesia and the Philippines, and the megadiverse Atlantic Forests and northern Andes of South America. Ecoregions with high impact scores and high deforestation rates (2000-2005) included montane forests in Cameroon and the Eastern Arc of Tanzania, although deforestation data were not available for all ecoregions. Ecoregions with high impact scores, high rates of recent deforestation and low coverage by the protected area network included Indonesia's Seram rain forests and the moist forests of Trinidad and Tobago. Key sites in these ecoregions represent some of the most urgent priorities for expansion of the global protected areas network to meet Convention on Biological Diversity targets to increase the proportion of land formally protected to 17% by 2020. Areas with high impact scores, rapid deforestation, low protection and high carbon storage values may represent significant opportunities for both biodiversity conservation and climate change mitigation, for example through Reducing Emissions from Deforestation and Forest Degradation (REDD+) initiatives.
Conflict of interest statement
Figures


References
-
- Margules CR, Pressey RL, Williams PH. Representing biodiversity: data and procedures for identifying priority areas for conservation. Journal of Biosciences. 2002;27:309–326. - PubMed
-
- Olson DM, Dinerstein E, Wikramanayake ED, Burgess ND, Powell GVN, et al. Terrestrial ecoregions of the world: a new map of life on Earth. Bioscience. 2001;51:933–938.
-
- Wilson KA, McBride MF, Bode M, Possingham HP. Prioritizing global conservation efforts. Nature. 2006;440:337–340. - PubMed
-
- Brooks TM, Mittermeier RA, da Fonseca GAB, Gerlach J, Hoffmann M, et al. Global biodiversity conservation priorities. Science. 2006;313:58–61. - PubMed
MeSH terms
Substances
LinkOut - more resources
Full Text Sources

