. 2012 Jan 27;45(2):196-209.
doi: 10.1016/j.molcel.2011.11.023. Epub 2011 Dec 28.

A two-dimensional ERK-AKT signaling code for an NGF-triggered cell-fate decision

Affiliations

A two-dimensional ERK-AKT signaling code for an NGF-triggered cell-fate decision

Jia-Yun Chen et al. Mol Cell. .

Abstract

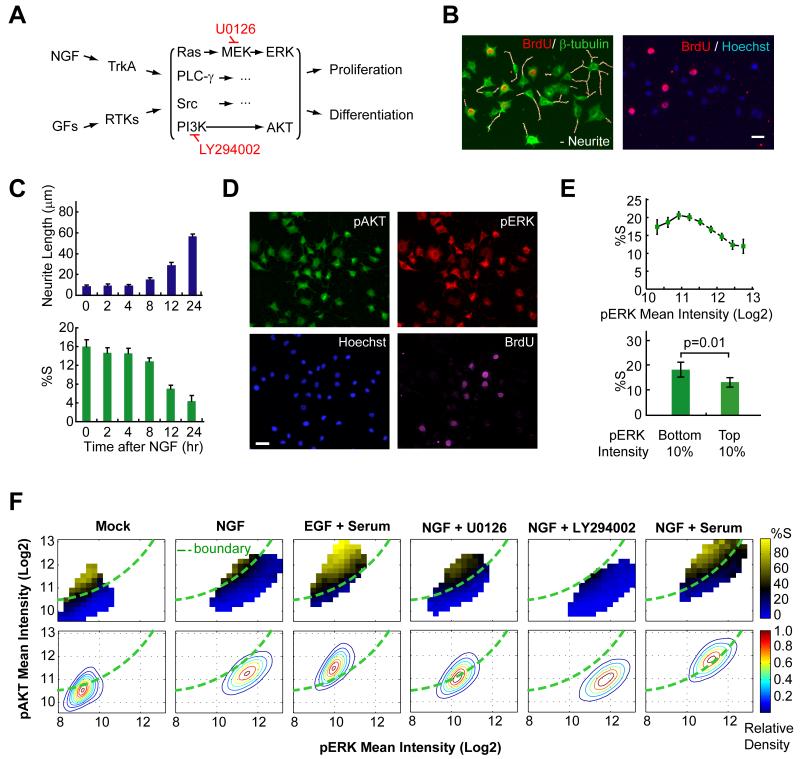
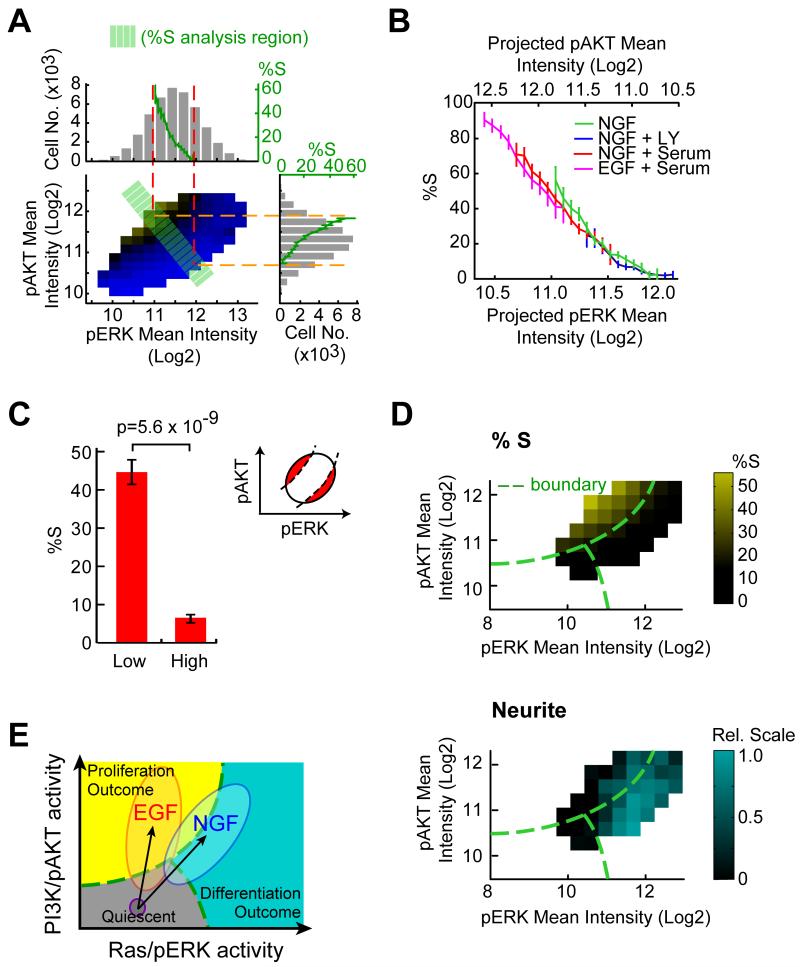
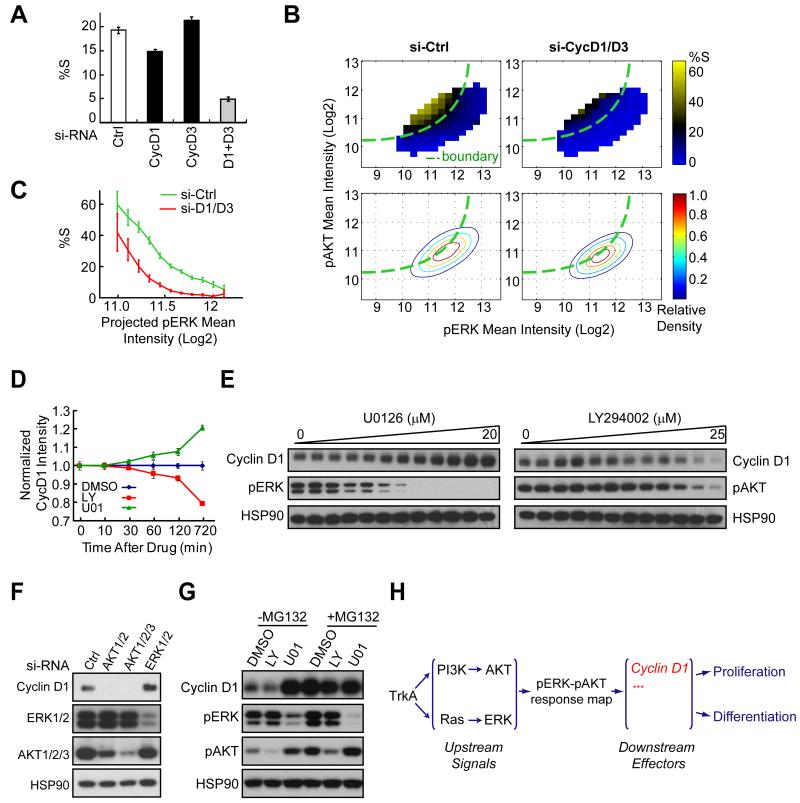
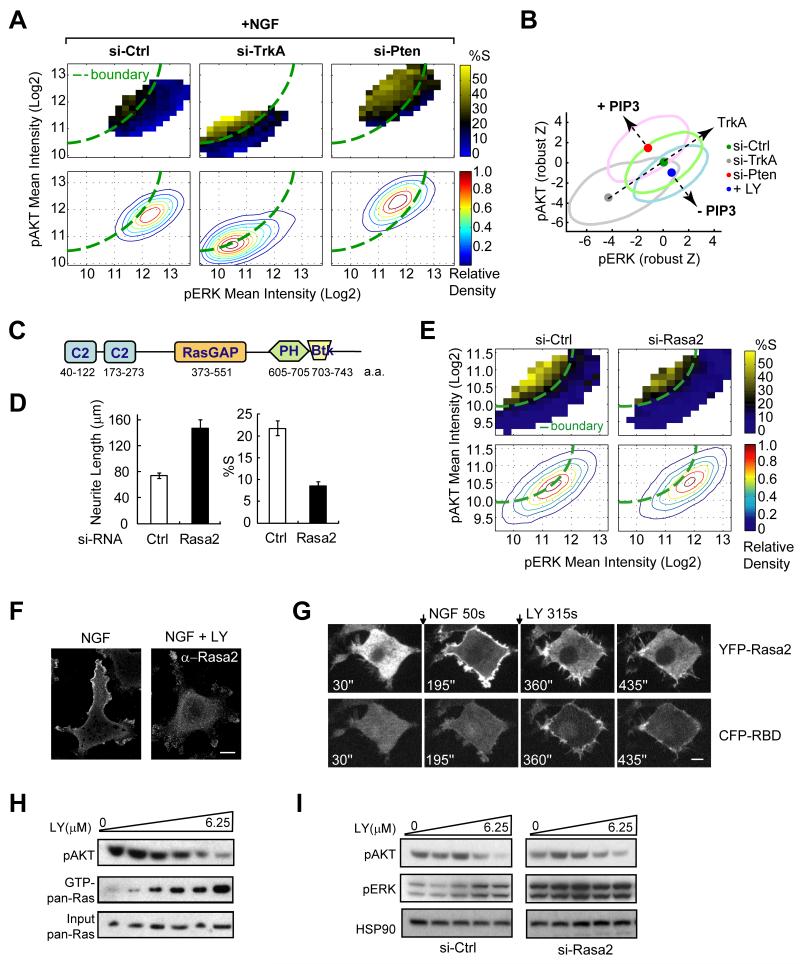
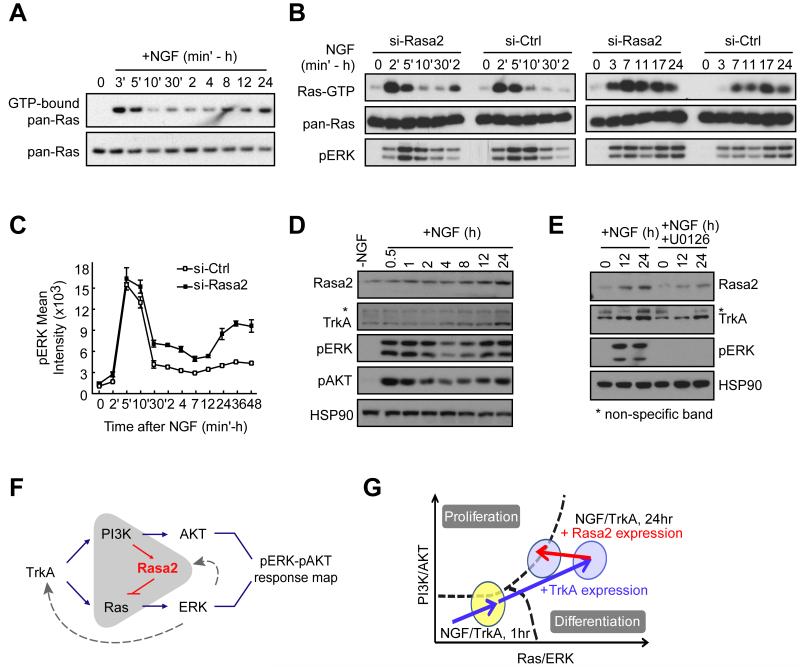
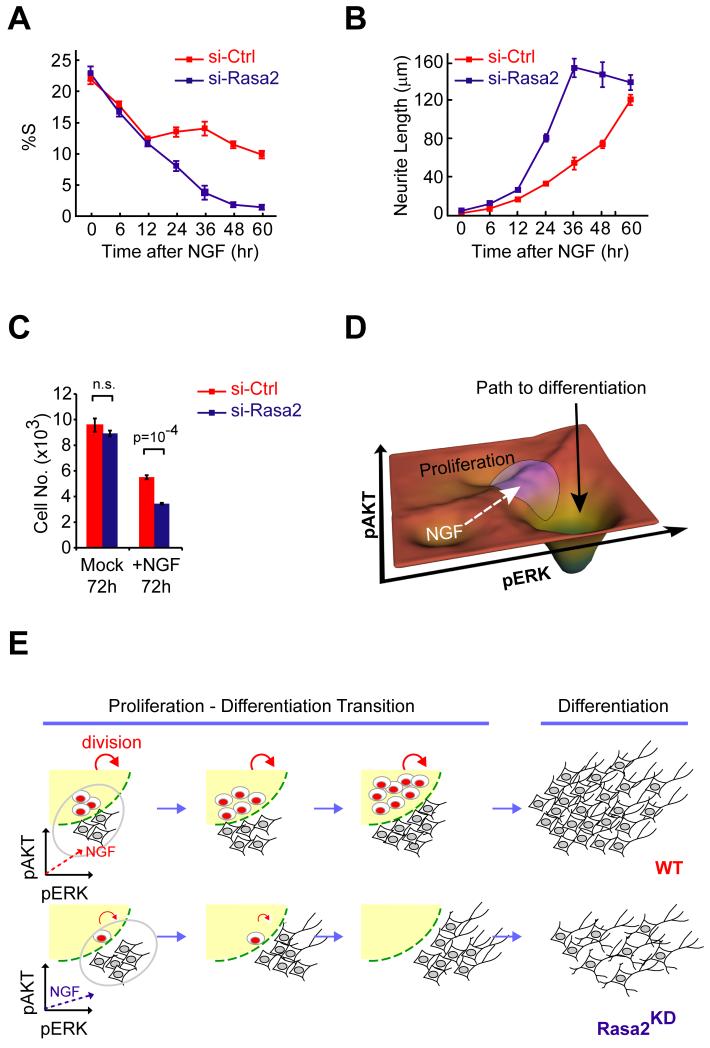
Growth factors activate Ras, PI3K, and other signaling pathways. It is not well understood how these signals are translated by individual cells into a decision to proliferate or differentiate. Here, using single-cell image analysis of nerve growth factor (NGF)-stimulated PC12 cells, we identified a two-dimensional phospho-ERK (pERK)-phospho-AKT (pAKT) response map with a curved boundary that separates differentiating from proliferating cells. The boundary position remained invariant when different stimuli were used or upstream signaling components perturbed. We further identified Rasa2 as a negative feedback regulator that links PI3K to Ras, placing the stochastically distributed pERK-pAKT signals close to the decision boundary. This allows for uniform NGF stimuli to create a subpopulation of cells that differentiates with each cycle of proliferation. Thus, by linking a complex signaling system to a simpler intermediate response map, cells gain unique integration and control capabilities to balance cell number expansion with differentiation.


Figures

Figure 1
Figure 1. Identification of a two dimensional pERK and pAKT signaling response map
(A) Schematics of growth factors (GFs) induced receptor signaling. RTKs: receptor tyrosine kinases. Inhibitors used in the study are marked in red. (B) Automated image analysis of differentiation and proliferation after 24h of NGF treatment. Representative images used for the analysis are shown. (Left) Detected neurites (white) were superimposed over a merged tubulin and BrdU-stained image. (Right) Overlay of BrdU and DNA-stained image. Scale bar: 40μm. (C) Time courses of differentiation and proliferation following NGF stimulation (mean ± SD of triplicate wells). (D) Automated image analysis monitors pAKT, pERK and proliferation after 24h of NGF treatment. (E) Single cell analysis of pERK level versus the fraction of cells in S-phase shows only little correlation. The %S was calculated for equally-spaced bins of the ERK activity (top, mean ± 95% bootstrap confidence interval) or from the bottom and top 10 percentile of the ERK activity (bottom, mean ± SD of five replicate wells) after NGF stimulation for 24 hrs. (F) Heat map analysis of pERK-pAKT signaling and proliferation shows a clear boundary between proliferation and differentiation regions. Contour plots of cell density are shown in the lower panels. The %S was calculated for equally-spaced bins of the ERK and AKT activity and is marked in a color code. Cells were left untreated (mock) or stimulated as indicated for 24h before analysis. U0126 and LY294002 were added with NGF for 24h at 3.3μM and 6.3μM, respectively. The boundary (green line) was drawn across the black colored-bins on the NGF heat map and overlaid on top of other plots. Each panel contains ~40,000 cells. Note that due to day-to-day staining and imaging variations, the boundary position compares experiments done at the same time.
Figure 2
Figure 2. A sharp boundary in the pERK-pAKT response map separates proliferating from differentiating cells
(A) Quantitative analysis of NGF-triggered cell-to-cell signal variation and proliferation probabilities in the pERK-pAKT plane. The population distributions of pERK and pAKT are shown in the subpanel top and right (gray histograms). The same histogram includes a graph (green curves) of the %S calculated from cells located in the green band (orthogonal to the boundary shown in Fig. 1F). (B) Evidence of an invariant 2D signaling response map that determines proliferative cell fate. Proliferation changes were analyzed as shown in (A) from cells treated with different stimuli. The analysis only included cells located within the green band. In (A) & (B), data are mean ± 95% bootstrap confidence interval. (C) The proliferative status is better predicted by the 2D response map compared to pERK level shown in Fig. 1E (bottom). The %S was compared for the 10 percentile of cells farthest above (Low) and below (High) the boundary. Inset shows the schematic diagram of the analysis region. Data are mean ± SD of five replicate wells. (D) Heat map analysis showing proliferation (top) and differentiation (bottom) as a function of ERK and AKT activity at a single-cell level after 24h of NGF stimulation. %S was quantified as shown in Fig. 1F. Quantification of the integrated single-cell neurite parameter was achieved by measuring the presence of neurites proximal to the cell body of each cell and calculating mean neurite intensity for each cell as a function of pERK and pAKT levels. Each bin contains at least 300 cells. (E) Different directions and amplitudes of pERK-pAKT activity vectors correlate with cell fates. The schematic also shows a quiescent state for low pERK and pAKT levels. EGF and NGF not only trigger different amplitudes of signal activation but also have different directions of pERK-pAKT activity vector in the 2D plane.
Figure 3
Figure 3. siRNA perturbation analysis validates the use of the signaling response map to predict cell fate
(A) Protocol used to screen for siRNAs that change the fraction of proliferating and differentiating cells. (B) Knockdown images of selected genes identified in the siRNA screen of regulators of NGF-induced differentiation. Arf5 reduces differentiation and Tao1K increases differentiation. Scale bar: 40μm. (C) Perturbation analysis with 54 siRNAs showing the correlation between proliferation and the induction of differentiation (data were from duplicate wells; robust z-score: the median absolute deviation from the control median). (D) NGF signaling scheme and the corresponding secondary assays used to link different signaling processes to differentiation. (E) Perturbation parameter cross-correlation analysis showing that the 24h pERK is the most predictive parameter for neurite extension (Nrt) and proliferation (%S), both measured at 48h. All 54 siRNAs were used for the analysis. ERK5’, 1h and 24h denote measurements of pERK at 5 min, 1h and 24h after NGF stimulation. EGR1 is the induction of the early growth response 1 transcription factor. AKT24h represents AKT phosphorylation at 24h of NGF stimulation. Color bar represents the cross-correlation values (Pearson’s correlation coefficients). (F) Direct correlation analysis comparing the short-term (5 min, left) and long-term ERK (24h, right) signaling with differentiation (neurite length) for all 54 siRNAs. For (C) & (F), green lines are linear fits and R represents Pearson’s correlation coefficients. (G) Center of population distribution for all 54 siRNAs in the pERK-pAKT plane. Each dot represents the population median of the pERK and pAKT intensity after individual siRNA knockdown. Green line: region boundary that crosses 20% of S phase probability based on control knockdown (red circle). (H) Separation of genes that shift the boundary (x-axis) or move the population center away from the boundary of controls (y-axis) upon siRNA knockdown. The boundary shift was calculated by the sum of %S differences between specific siRNA knockdown and control per pERK-pAKT bin in the 2D plane. Movement of population relative to the boundary was represented as the orthogonal distance (Log2 unit) from the center of population distribution to the boundary (as shown in Fig. 3G). Knockdowns of cell cycle regulators (red circle) that shifted the boundary to the negative side include cyclin D1/D3, Cdks 1, 2, 4, 6 and Mdm4. The positive side contains the tumor suppressors Rb1, p21 and p16. SD represents the standard deviation calculated from all the siRNAs.
Figure 4
Figure 4. The cell fate decision is in part mediated by pERK and pAKT-control of cyclin D1 protein stability
(A) Quantitative analysis of the effect of cyclin D1/D3 single and co-knockdown on proliferation. siRNA treated cells were stimulated with NGF for 24h before analysis (mean ± SD of triplicate wells). (B) Heat map analysis of the cyclinD1/D3 knockdown effect on pERK-pAKT signaling and proliferation. The knockdown (right) shifted the boundary to the top-left between the differentiation and proliferation regions without significantly changing the pERK and pAKT distribution itself. Assays were performed as described in Fig. 1D & 1F. (C) Evidence of the boundary shift with cyclin D1/D3 co-knockdown. Proliferation changes were calculated from cells located in the region orthogonal to the boundary as shown in Fig. 2A (mean ± 95% bootstrap confidence interval). (D) Time courses of the effects of PI3K (LY294002) and MEK inhibition (U0126) on cyclin D1 protein levels. 12.5μM LY294002 or 10μM U0126 was added at 24h after NGF stimulation for different lengths of time as indicated before immunostaining. Cyclin D1 levels were measured by automated image analysis (mean ± SD of triplicate wells). (E) Dose effects of U0126 and LY294002 on cyclin D1 protein level changes. Cells were treated with increasing doses of U0126 or LY294002 together with NGF for 4 hours. (F) Knockdown of AKT or ERK mimics the LY294002 and U0126 drug effects on cyclin D1 protein level changes. Knockdown cells were subjected to 24h of NGF stimulation before analysis. (G) The opposing regulation of cyclin D1 protein level by LY294002 and U0126 is proteasome-dependent. Cells were stimulated with NGF for 4 hours with the drug combination as indicated. MG132 was used at 50μM. LY294002 and U0126 were used at 12.5μM and 10μM, respectively. (H) Schematics of signaling diagram showing cyclin D1 as one of the downstream mediators linking the pERK-pAKT response map to cell fates.
Figure 5
Figure 5. Rasa2 increases the number of proliferating cells after NGF stimulation by adding a negative feedback from PI3K to Ras and ERK signaling
(A) Heat map analysis of PTEN and TrkA siRNA effects on pERK-pAKT signaling and proliferation. Assays were performed as described in Fig. 1F. (B) Changes in PIP3 levels cause a shift of the activation vector orthogonal to NGF activation. Data from Fig. 1F & Fig. 5A were normalized to their respective control and plotted together with robust z-score units. The large ovals represent the population distributions and the small filled circles represent the centroids of each population. (C) Domain structure of Rasa2. (D) Quantitative analysis of the effect of Rasa2 knockdown on reducing proliferation and increasing differentiation (mean ± SD of triplicate wells). (E) Heat map analysis of the Rasa2 siRNA-mediated shift of the population distribution towards higher pERK levels. Assays were performed as described in Fig. 1F. The boundary was drawn according to control cells. (F) Membrane localization of endogenous Rasa2. Cells after 24h of NGF stimulation were left untreated (left) or treated with PI3K inhibitor (LY294002 at 25μM) for 5 min before subjected to Rasa2 antibody staining. Scale bar: 10μm. (G) Time series of images showing YFP-Rasa2 (top) and CFP-RBD (bottom) translocation after NGF stimulation and subsequently, after PI3K inhibitor (LY294002) addition. Cells were co-transfected with YFP-Rasa2, CFP-RBD (Raf) and H-Ras. CFP and YFP confocal images were taken from the same representative cell. NGF and LY (100μM) were added as indicated. Ras activity was monitored using the relative plasma membrane translocation of CFP-RBD. Scale bar: 5μm. (H) Ras pull-down followed by western blotting showing that inhibition of PI3K is paralleled by an increase of GTP-bound Ras level. Cells were treated with increasing dose of PI3K inhibitor (0 to 6.25μM, 2-fold dilution from the right) for 15 min at 24h post NGF stimulation. (I) Analysis of control and Rasa2 siRNA effect on ERK activity changes in response to PI3K inhibition. Cells were treated as described in (H) and assayed by western blotting.
Figure 6
Figure 6. NGF-triggered expression of Rasa2 and TrkA directs the pERK-pAKT activation vector close to the boundary
(A) NGF stimulation triggers two waves of Ras activation. (B) Knockdown of Rasa2 enhances Ras and pERK activities during the second wave. For (A) & (B), Ras pull-down assays were performed at the indicated time and assayed by western blotting. (C) Knockdown of Rasa2 selectively enhances a second wave of pERK activation with little effect on the first peak (mean ± SD of triplicate wells). (D) Time course analysis of Rasa2 and TrkA expression compared to pERK and pAKT activation. Cells were assayed by western blotting. HSP90 was shown as a protein loading control. (E) TrkA and Rasa2 upregulation is partially dependent on MEK signaling. U0126 was used at 10μM. (F) Schematic representation of the feedback between PI3K, Rasa2 and Ras. (G) Schematic model of the roles of the positive TrkA expression feedback, which increases the amplitude of the activation vector, and the negative Rasa2 expression feedback that turns the activation vector closer to the proliferation boundary.
Figure 7
Figure 7. Function of the pERK-pAKT response map in balancing cell number expansion and differentiation
(A & B) Time course analysis of proliferation (A) and neurite extension (B) in control and Rasa2 knockdown cells following NGF stimulation (mean ± SD of four replicate wells). In (A), subpopulations of control cells stay proliferative over a period of 60h while Rasa2 knockdown cells cease to proliferate after 48h of NGF stimulation. (C) Quantification of Rasa2 knockdown effect on cell number expansion following NGF stimulation. Cells transfected with control or Rasa2 siRNA were treated with Mock or NGF for 3 days before counting cell number (mean ± SD of four replicate wells). (D) Landscape scheme of the 2D pERK-pAKT response map emphasizes the boundary between the two regions that predict the proliferation and differentiation outcomes. The purple circle depicts the variation of the NGF-induced signaling response that spreads the population of cells across the boundary. The white dashed arrow reflects the NGF-induced shift of the activation vector and the black solid arrow depicts the path to differentiation. (E) Schematic showing how Rasa2 maintains a balance between cell number expansion and differentiation.

Comment in

Similar articles

Cited by

References

    1. Acar M, Pando BF, Arnold FH, Elowitz MB, van Oudenaarden A. Science. Vol. 329. New York, N.Y: 2010. A general mechanism for network-dosage compensation in gene circuits; pp. 1656–1660. - PMC - PubMed
    1. Albert R. Scale-free networks in cell biology. Journal of cell science. 2005;118:4947–4957. - PubMed
    1. Arias AM, Hayward P. Filtering transcriptional noise during development: concepts and mechanisms. Nat Rev Genet. 2006;7:34–44. - PubMed
    1. Balazsi G, van Oudenaarden A, Collins JJ. Cellular decision making and biological noise: from microbes to mammals. Cell. 2011;144:910–925. - PMC - PubMed
    1. Bar-Sagi D, Feramisco JR. Microinjection of the ras oncogene protein into PC12 cells induces morphological differentiation. Cell. 1985;42:841–848. - PubMed

Publication types

MeSH terms

Substances

LinkOut - more resources