. 2012 Apr 1;71(7):603-10.
doi: 10.1016/j.biopsych.2011.10.038. Epub 2011 Dec 28.

Neural activation during facial emotion processing in unmedicated bipolar depression, euthymia, and mania

Affiliations

Neural activation during facial emotion processing in unmedicated bipolar depression, euthymia, and mania

Leslie A Hulvershorn et al. Biol Psychiatry. .

Abstract

Background: Studies incorporating direct comparisons across all phases of bipolar (BP) disorder are needed to elucidate the pathophysiology of bipolar disorder. However, functional neuroimaging studies that differentiate bipolar mood states from each other and from healthy subjects are few and have yielded inconsistent findings.

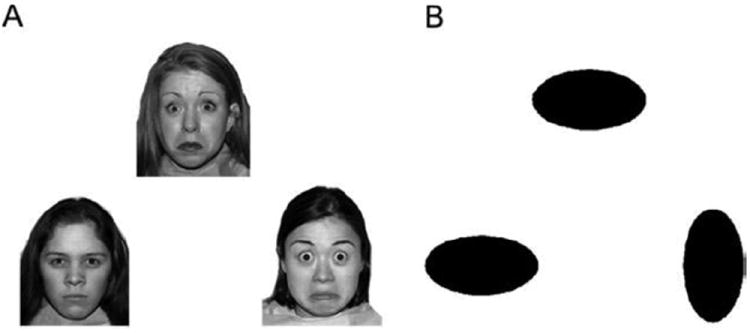
Methods: One hundred five unmedicated adults were recruited: 30 with current bipolar depression (BPD), 30 with current bipolar hypomania or mania (BPM), 15 bipolar euthymic (BPE), and 30 healthy control subjects (HC). All subjects were diagnosed with DSM-IV BP (type I or II) using a structured clinical interview. Groups were age- and gender-ratio matched. In 3T functional magnetic resonance imaging experiments, subjects completed a negative facial emotion matching task.

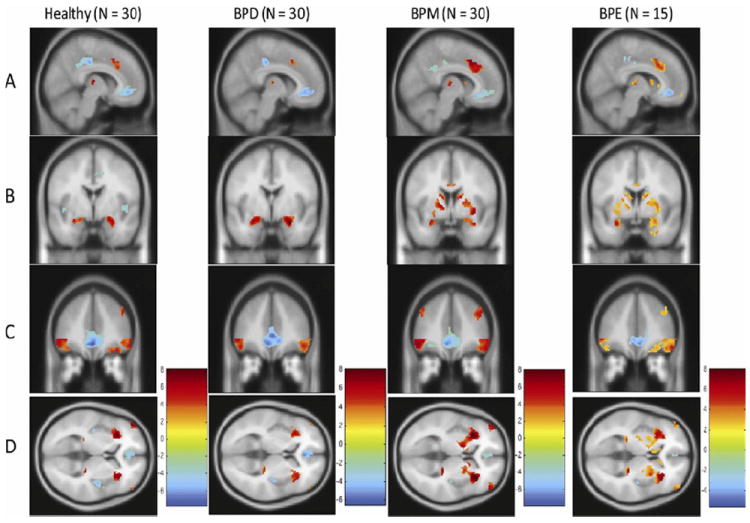
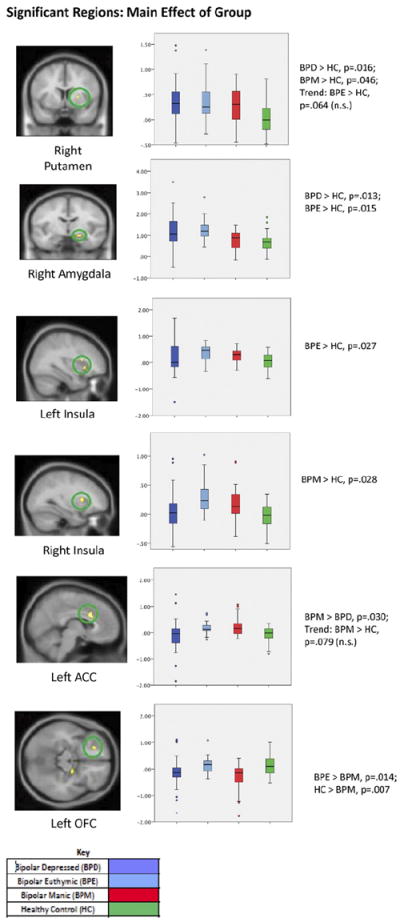
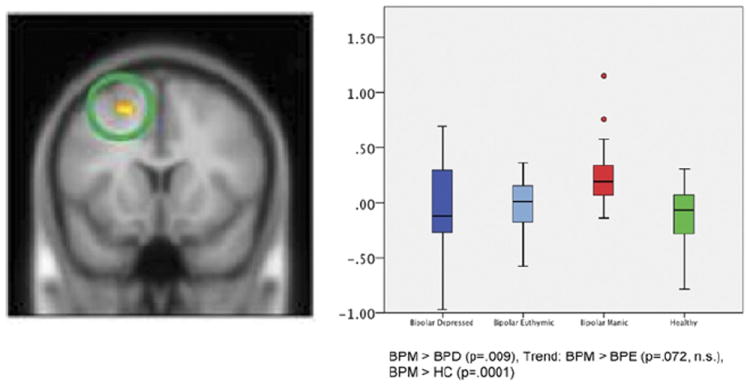
Results: Bipolar euthymic and BPD groups exhibited increased amygdala activation compared with HCs in response to the negative faces; however, in the BPM group, this increase was not seen. Conversely, both BPE and BPM groups had increased activation in the insula relative to HCs, but in the BPD group, this effect was not seen. All three BP groups exhibited increased activation of the putamen compared with HCs. In the cortical areas, the BPM group exhibited decreased left lateral orbitofrontal cortex activation compared with both BPEs and HCs, increased dorsal anterior cingulate cortex activation compared with the BPD group, and increased dorsolateral prefrontal cortical activation compared with all other groups.

Conclusions: Both state- and trait-related abnormalities in corticolimbic activation were seen in response to the negative facial emotion processing in a large sample of unmedicated adults across BP mood states.


Conflict of interest statement

The authors report no biomedical financial interests or potential conflicts of interest relevant to the conduct of this study.

Figures

Figure 1
Figure 1
(A) Angry/worried faces (26) and (B) shapes used as experimental and control stimuli, respectively, for the functional magnetic resonance imaging task.
Figure 2
Figure 2
Within-group activation in a priori regions for the shapes versus faces condition in the four groups; healthy, bipolar depressed (BPD), bipolar manic (BPM), and bipolar euthymic (BPE). Group differences are seen following regions, by row, with nearest slice coordinates: (A) dorsal anterior cingulate cortex (x = 8); (B) amygdala and putamen (y = 2); (C) dorsolateral prefrontal cortex and orbitofrontal cortex (y = 40); (D) insula (z = 4). Activation maps are depicted at p = .01 false discovery rate corrected, threshold ≥20 for all groups except for BPE group, where the map is depicted at p = .05, false discovery rate corrected threshold because of fewer number of subjects in the BPE group.
Figure 3
Figure 3
Results of four-group analysis of variance main effect for a priori identified regions (p < .01 uncorrected, k ≥ 10) and subsequent least significant difference corrected post hoc analysis. Box plots show the distribution of mean activation within each group, including the minimum, median, and maximum values. Error bars show the standard deviation, and data points outside the box are outliers. The y axis represents the mean T value of extracted activation, statistically corrected for age, gender, race, task accuracy, and reaction time, ranging from −2 to 4. Six clusters were significant, including the right putamen (peak z = 2.87; extent = 10 voxels, Montreal Neurological Institute [MNI] coordinates (x, y, z) of peak = 24, 6, 4); the right amygdala (Brodmann area [BA] 34; peak z = 3.03; extent = 17 voxels; MNI coordinates of peak = 20, −8, −14); the left insula (BA 13; peak z = 3.27; extent = 18 voxels; MNI coordinates of peak = −30, 14, 10); the right insula (BA 13/47; peak z = 2.84; extent = 11 voxels; MNI coordinates of peak = 34, 20, −2); the left ACC (BA 24; peak z = 3.26; extent = 52 voxels; MNI coordinates of peak = 6, 16, 28); and the left OFC (BA 11; peak z = 3.05; extent = 13 voxels; MNI coordinates of peak = −22, 36, −14). Results of between-group t tests comparing extracted clusters are shown under each graph (least significant difference corrected significance threshold, p < .05). ACC, anterior cingulate cortex; n.s., nonsignificant; OFC, orbitofrontal cortex.
Figure 4
Figure 4
Between-group differences seen without a priori masked regions of interest. Box plots show the distribution of mean activation within each group, including the minimum, median, and maximum values. Error bars show the standard deviation, and data points outside the box are outliers. The y axis represents the mean T value of extracted activation, statistically corrected for gender and task performance, ranging from −1 to 1.5. Wholebrain voxelwise activation (p < .001, uncorrected) was seen in the left superior frontal gyrus of the dorsolateral prefrontal cortex (Brodmann area 6, peak z = 4.23, extent = 115 voxels; Montreal Neurological Institute coordinates [x, y, z] of peak: [−18, 12, 52]). Clusterwise significance is p < .05 (corrected). BPD, bipolar depressed; BPE, bipolar euthymic; BPM, bipolar manic; HC, healthy control; n.s., nonsignificant.

Comment in

References

    1. Almeida JR, Versace A, Hassel S, Kupfer DJ, Phillips ML. Elevated amygdala activity to sad facial expressions: A state marker of bipolar but not unipolar depression. Biol Psychiatry. 2010;67:414–421. - PMC - PubMed
    1. Drevets WC, Price JL, Simpson JR, Jr, Todd RD, Reich T, Vannier M, Raichle ME. Subgenual prefrontal cortex abnormalities in mood disorders. Nature. 1997;386:824–827. - PubMed
    1. Phillips ML, Drevets WC, Rauch SL, Lane R. Neurobiology of emotion perception II: Implications for major psychiatric disorders. Biol Psychiatry. 2003;54:515–528. - PubMed
    1. Chang K, Adleman NE, Dienes K, Simeonova DI, Menon V, Reiss A. Anomalous prefrontal-subcortical activation in familial pediatric bipolar disorder: A functional magnetic resonance imaging investigation. Arch Gen Psychiatry. 2004;61:781–792. - PubMed
    1. Altshuler L, Bookheimer S, Townsend J, Proenza MA, Sabb F, Mintz J, Cohen MS. Regional brain changes in bipolar I depression: A functional magnetic resonance imaging study. Bipolar Disord. 2008;10:708–717. - PMC - PubMed

Publication types

MeSH terms