. 2012 Jan 27;36(1):68-78.
doi: 10.1016/j.immuni.2011.12.007. Epub 2011 Dec 28.

Mitochondrial respiratory capacity is a critical regulator of CD8+ T cell memory development

Affiliations

Mitochondrial respiratory capacity is a critical regulator of CD8+ T cell memory development

Gerritje J W van der Windt et al. Immunity. .

Abstract

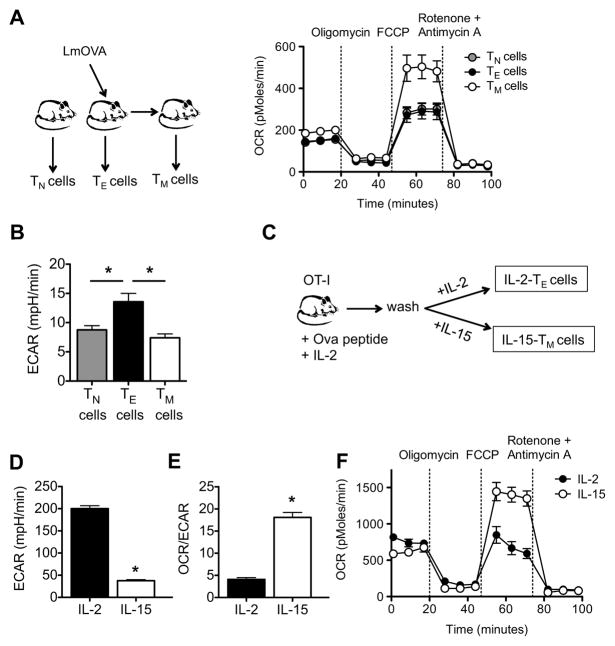
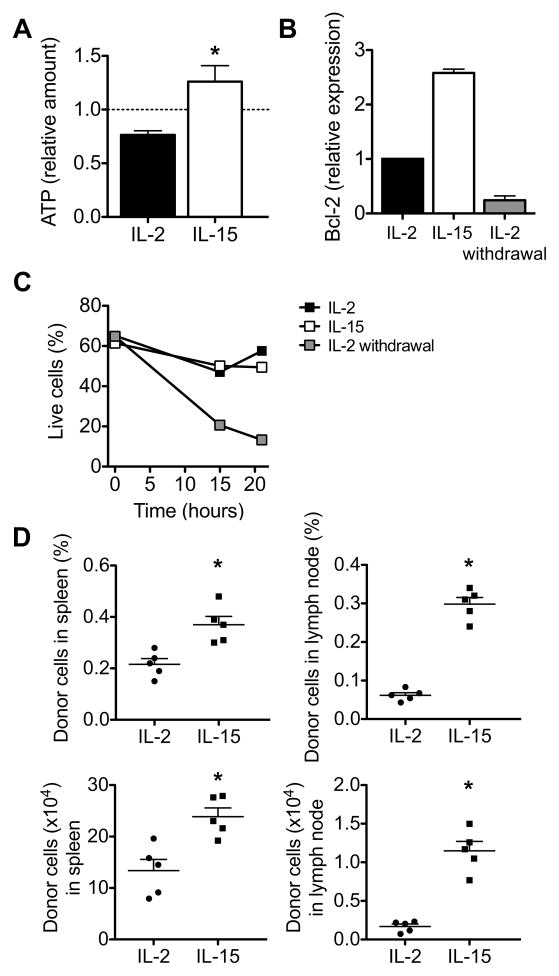
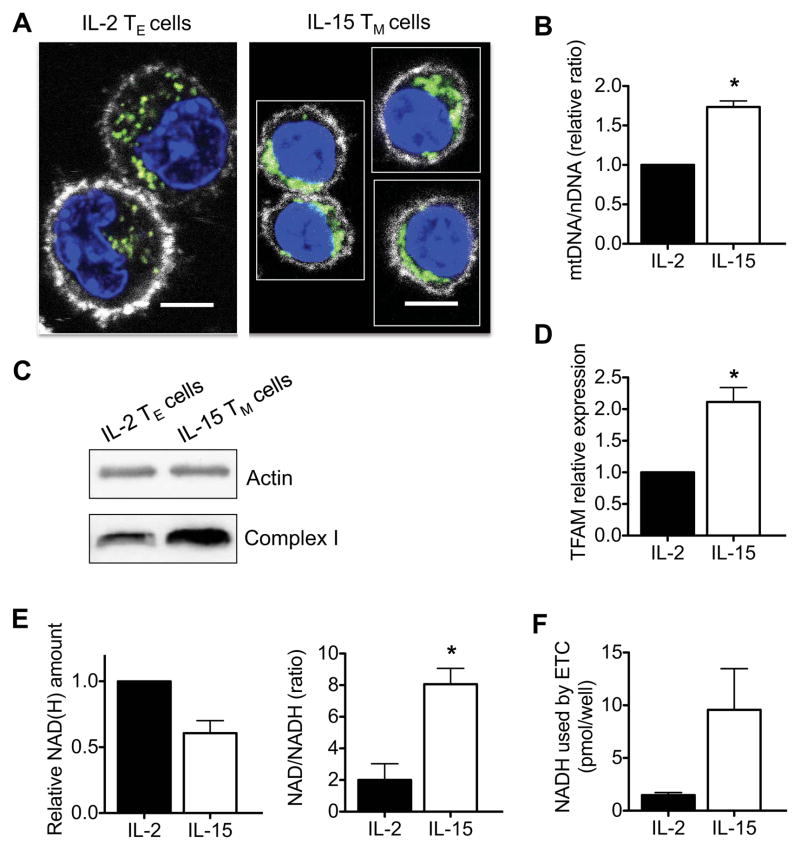
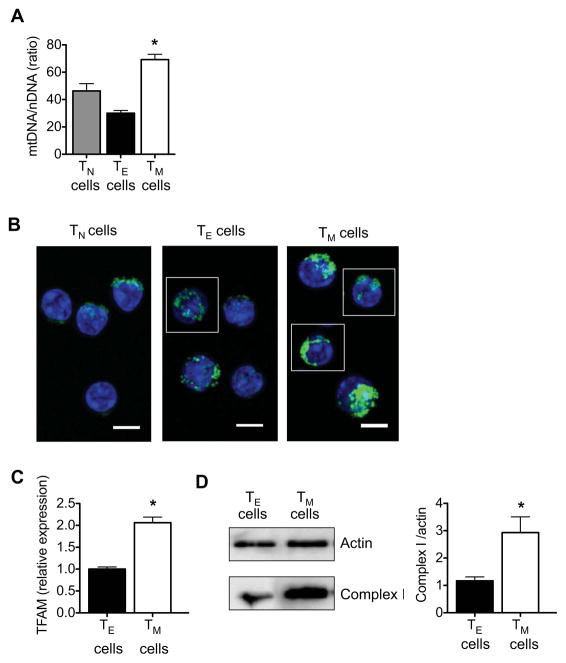
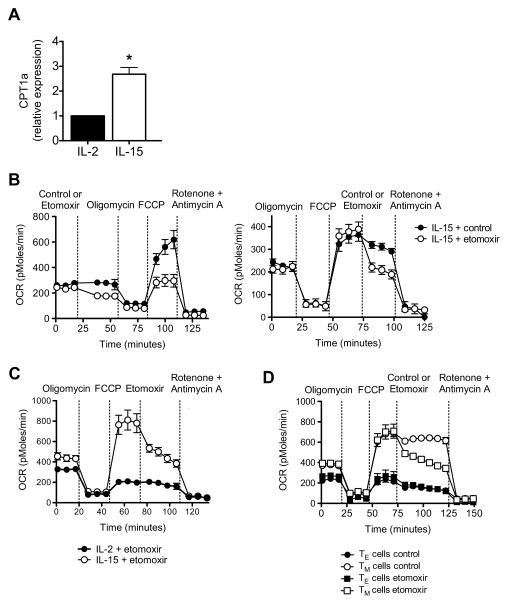
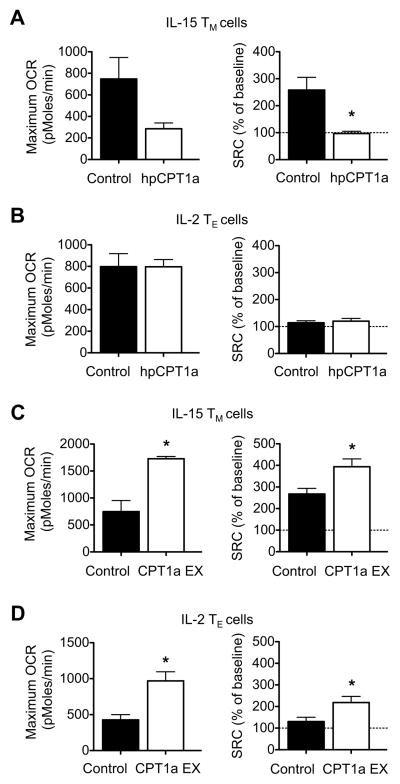
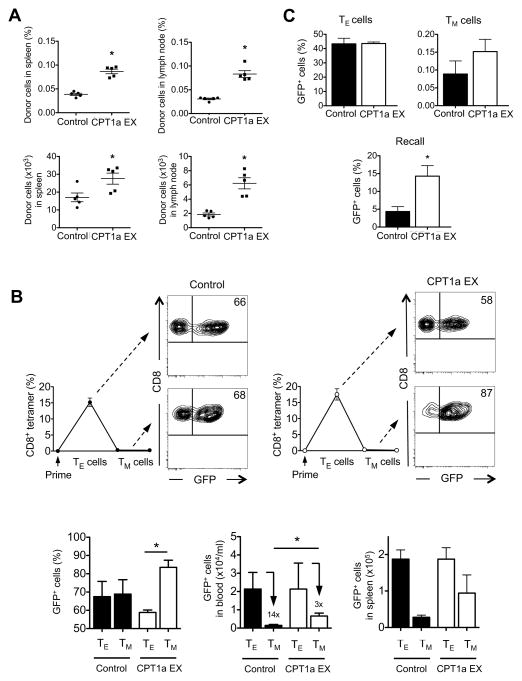
CD8(+) T cells undergo major metabolic changes upon activation, but how metabolism influences the establishment of long-lived memory T cells after infection remains a key question. We have shown here that CD8(+) memory T cells, but not CD8(+) T effector (Teff) cells, possessed substantial mitochondrial spare respiratory capacity (SRC). SRC is the extra capacity available in cells to produce energy in response to increased stress or work and as such is associated with cellular survival. We found that interleukin-15 (IL-15), a cytokine critical for CD8(+) memory T cells, regulated SRC and oxidative metabolism by promoting mitochondrial biogenesis and expression of carnitine palmitoyl transferase (CPT1a), a metabolic enzyme that controls the rate-limiting step to mitochondrial fatty acid oxidation (FAO). These results show how cytokines control the bioenergetic stability of memory T cells after infection by regulating mitochondrial metabolism.


Figures

Figure 1
Figure 1. CD8+ TM cells have substantial mitochondrial spare respiratory capacity
Spleens and lymph nodes were harvested from naive and LmOVA infected mice, and TN, TE, and TM cells were isolated. (A) O2 consumption rates (OCR) were measured in real time under basal conditions and in response to indicated mitochondrial inhibitors; P < 0.0001 after FCCP injection. Data are representative of 4 independent experiments. (B) Extracellular acidification rates (ECAR) were measured under basal conditions; *P < 0.01 for TE versus TN cells, and < 0.01 for TE versus TM cells. Data are representative of 2 independent experiments. (C-F) OT-I cells were activated with OVA peptide for 3 days, and subsequently cultured in either IL-2 or IL-15 to generate IL-2 TE and IL-15 TM cells, respectively. Basal extracellular acidification rate (ECAR) (D), basal OCR/ECAR ratio (E), and OCR under basal conditions and in response to indicated mitochondrial inhibitors (F) in IL-2 TE and IL-15 TM cells are shown; *P < 0.0001 (D), < 0.0001 (E), <0.0001 (F after FCCP). Data are representative of at least 3 independent experiments. Data are shown as mean ± SEM. See also Figure S1.
Figure 2
Figure 2. IL-15 signals promote CD8+ T cell survival
OT-I cells were activated with OVA peptide for 3 days, and subsequently cultured in either IL-2 or IL-15. (A) IL-2 TE and IL-15 TM cells were re-stimulated with anti-CD3 and anti-CD28 for 5 hours and the amounts of re-stimulation induced ATP are shown relative to non-re-stimulated cells (dashed line); *P = 0.03. Data are shown as mean ± SEM and are representative of 2 independent experiments. (B-C) IL-2 cultured cells were withdrawn from IL-2 for 6–8 hours, and (B) relative Bcl-2 mRNA expression and (C) percentage live cells (based on 7-AAD analysis) are shown. Data are shown as the mean ± SEM (figure generated from 2 independent experiments) (B) or as a representative experiment of 3 independent experiments (C). (D) IL-2 TE and IL-15 TM cells were adoptively transferred into congenic recipients (n = 5 per group), and organs were harvested 2 days later, dot plots show percentages, top panels, or total numbers, bottom panels, of donor cells. Data are shown as mean ± SEM. Data are representative of 2 independent experiments. *P = 0.004 (top left), < 0.0001 (top right), 0.005 (bottom left), and < 0.0001 (bottom right). See also Figure S2.
Figure 3
Figure 3. IL-15 induces mitochondrial biogenesis in CD8 +T cells
IL-2 TE and IL-15 TM cells were analyzed (A-F). (A) Confocal images show cells stained with Mitotracker (green), Hoechst (blue), and anti-CD8 (white), scale bars are 5 microns. (B) mtDNA/nDNA ratio (figure generated from 2 independent experiments) *P = 0.01, (C) Western analysis for complex I expression, and (D) relative mitochondrial transcription factor A (TFAM) mRNA expression (figure generated from 5 independent experiments) in IL-2 TE and IL-15 TM cells; *P = 0.008. (E) Relative total amount of NAD(H), NAD/NADH ratio, and (F) NADH consumed by the ETC (measured as NADH built up after ETC blockade) in IL-2 TE and IL-15 TM cells (figures generated from 3 independent experiments); *P = 0.03. Data are shown as mean ± SEM. Data in A and C are representative of at least 3 independent experiments. See also Figure S3.
Figure 4
Figure 4. CD8+ TM cells have greater mitochondrial mass than CD8+ TE cells
Spleens and lymph nodes were harvested from naive and LmOVA infected mice, and TN, TE, and TM cells were isolated. (A) mtDNA/nDNA ratio (data are shown as mean ± SEM, figure generated from 2 independent experiments) *P < 0.01 for TE vs TM cells, and < 0.05 for TN vs TM cells. (B) Confocal images show TN, TE and TM cells stained with Mitotracker (green) and Hoechst (blue), scale bars are 5 microns. (C) Relative mitochondrial transcription factor A (TFAM) mRNA expression (data are shown as mean ± SEM, figure generated from 2 independent experiments) *P = 0.01, and (D) Western analysis for complex I expression (bars depict quantification of densitometry from 3 blots) *P = 0.008. Data are representative of 2 independent experiments.
Figure 5
Figure 5. Spare respiratory capacity in CD8+ T cells is dependent on mitochondrial FAO
(A) Relative CPT1a mRNA expression in IL-2 TE and IL-15 TM cells (figure generated from data from 5 independent experiments); *P = 0.003. Oxygen consumption rates (OCR) in IL-15 TM cells (B), in IL-2 TE and IL-15 TM cells (C), and bona fide TE and TM cells isolated from LmOVA infected B6 mice (D), under basal conditions and in response to indicated drugs; P < 0.0001 (after FCCP in B left panel), < 0.01 (after etomoxir in B right panel), and < 0.0001 (for TM cells after etomoxir versus control, D). See also Figure S4.
Figure 6
Figure 6. Spare respiratory capacity in CD8+ T cells is dependent on CPT1a expression
Maximum OCR (as indicated by OCR after injection of oligomycin and subsequent FCCP) and spare respiratory capacity (indicated by maximum OCR calculated as percentage of baseline OCR) in IL-15 TM cells(A, C) and IL-2 TE cells (B, D) cells transduced with either control (virus expressing shRNA against luciferase) or virus expressing shRNA against CPT1a (hpCPT1a) (A, B), and either control (empty vector) or CPT1a expressing (EX) retrovirus (C, D); *P = 0.03 (A), 0.003 (max OCR) and 0.02 (SRC) (C), 0.006 (max OCR) and 0.03 (SRC) (D). Data are representative of at least 2 independent experiments, and shown as mean ± SEM. See also Figure S5.
Figure 7
Figure 7. Mitochondrial FAO enhances T cell survival and promotes CD8+ TM cell development
OVA peptide activated OT-I cells transduced with control (empty vector) or CPT1a expressing (EX) retrovirus were intravenously injected into congenic recipients (n = 5 per group), and (A) organs were harvested 2 days later, dot plots show percentages (top panels), or total numbers (bottom panels) of donor cells (mean ± SEM); *P < 0.0001 (top left), < 0.0001 (top right), 0.03 (bottom left), and 0.0006 (bottom right), or (B) mice were infected with LmOVA, and peripheral blood CD8+ T cells were analyzed by KbOVA tetramer (line graphs) and GFP for retroviral expression (contour plots) at the peak of the response (TE cells, day 7) and after contraction (TM cells, day 14). Contour plots and bar graphs show the frequency of transduced (GFP+) cells within the CD8+ and KbOVA tetramer positive gate in blood (left bar graph; *P = 0.0003), absolute numbers of transduced (GFP+) cells/ml blood (middle bar graph, data are normalized to control TE cells; P = 0.02, numbers above bars indicate fold contraction), and absolute numbers of transduced (GFP+) cell in spleen (right bar graph, data are normalized to control TE cells). Data are shown as mean ± SEM and are representative of at least 2 independent experiments with at least 5 mice per group. (C) OT-I cells transduced with control (empty vector) or CPT1a expressing (EX) retrovirus were intravenously injected into IL-15 deficient recipients (n = 5 per group) and mice were infected with LmOVA. Bar graphs show the frequency of transduced (GFP+) cells within the KbOVA tetramer gate at the peak of the response (TE cells, day 7), after contraction (TM cells, day 14) and after challenge (recall, day 5 post challenge); *P = 0.01. Data are shown as mean ± SEM and are representative of 2 independent experiments. See also Figure S6.

Comment in

References

    1. Beeson CC, Beeson GC, Schnellmann RG. A high-throughput respirometric assay for mitochondrial biogenesis and toxicity. Anal Biochem. 2010;404:75–81. - PMC - PubMed
    1. Brand KA, Hermfisse U. Aerobic glycolysis by proliferating cells: a protective strategy against reactive oxygen species. FASEB J. 1997;11:388–395. - PubMed
    1. Carrio R, Bathe OF, Malek TR. Initial antigen encounter programs CD8+ T cells competent to develop into memory cells that are activated in an antigen-free, IL-7- and IL-15-rich environment. J Immunol. 2004;172:7315–7323. - PubMed
    1. Chang JT, Palanivel VR, Kinjyo I, Schambach F, Intlekofer AM, Banerjee A, Longworth SA, Vinup KE, Mrass P, Oliaro J, et al. Asymmetric T lymphocyte division in the initiation of adaptive immune responses. Science. 2007;315:1687–1691. - PubMed
    1. Choi SW, Gerencser AA, Nicholls DG. Bioenergetic analysis of isolated cerebrocortical nerve terminals on a microgram scale: spare respiratory capacity and stochastic mitochondrial failure. J Neurochem. 2009;109:1179–1191. - PMC - PubMed

Publication types