Comparative Study
. 2012 May;27(5):843-9.
doi: 10.1007/s00467-011-2073-9. Epub 2011 Dec 30.

Comparing cystatin C and creatinine in the diagnosis of pediatric acute renal allograft dysfunction

Affiliations
Comparative Study

Comparing cystatin C and creatinine in the diagnosis of pediatric acute renal allograft dysfunction

Pauline R Slort et al. Pediatr Nephrol. 2012 May.

Abstract

Background: Allograft function following renal transplantation is commonly monitored using serum creatinine. Multiple cross-sectional studies have shown that serum cystatin C is superior to creatinine for detection of mild to moderate chronic kidney dysfunction. Recent data in adults indicate that cystatin C might also be a more sensitive marker of acute renal dysfunction. This study aims to compare cystatin C and creatinine for detection of acute allograft dysfunction in children using pediatric RIFLE (risk of renal dysfunction, injury to the kidney, failure or loss of kidney function, end stage renal disease) criteria for acute kidney injury.

Methods: Retrospective chart review of post-transplant period in 24 patients in whom creatinine and cystatin C were measured every day. Allograft dysfunction was defined as a sustained rise in marker concentration above the mean of the three preceding measurements.

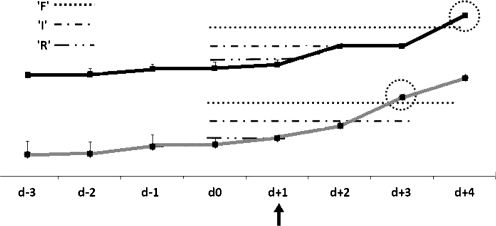
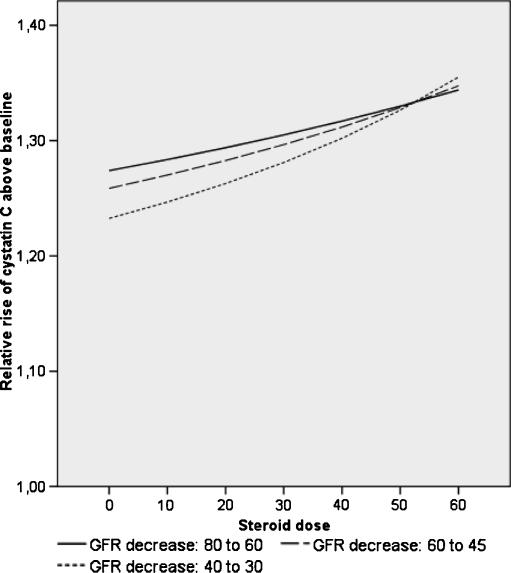
Results: In total, there were 13 episodes of allograft dysfunction. Maximum RIFLE stages with creatinine were 'R' in 7, 'I' in 4, and 'F' in 2, with cystatin C 'R' in 6, 'I' in 4 and 'F' in 3, respectively. In 9/13 cases, both markers rose simultaneously, in three, the rise in creatinine preceded cystatin C by 1-5 days (median 4). In one case, the rise in cystatin C preceded creatinine by 1 day. The time lag was not statistically different. The maximum relative rise of creatinine was significantly higher than cystatin C. By multiple linear regression analysis, the maximum rise of cystatin C was related to the maximum rise of creatinine, but independent of patient age, gender, steroid dose, and anthropometric data.

Conclusions: In this pediatric population, cystatin C was not superior to creatinine for the detection of acute allograft dysfunction.


Figures

Fig. 1
Fig. 1
Method for calculation of time-lag to fulfill RIFLE (risk of renal dysfunction, injury to the kidney, failure or loss of kidney function, end stage renal disease) criteria. The grey marker reaches "RIFLE R" on day + 1 (arrow), which defines the start of the episode. The mean concentration of day –2 to day 0 is used as baseline for calculation of the time-lag. In the example, "RIFLE F" is reached on day +3 by the marker presented in grey and on day +4 by the black marker
Fig. 2
Fig. 2
a, b Pharmacokinetic models illustrating the relative rise of creatinine above baseline at different levels of glomerular filtration rate (GFR) in time. Course of calculated creatinine concentrations following an acute decrease in GFR at time 24 h at two different levels of GFR. Presentation of the relative rise compared to baseline corresponds to a GFR of 100 ml/min/1.73 m2 (Fig. 2a) and a GFR of 50 ml/min/1.73 m2 (Fig. 2b)
Fig. 3
Fig. 3
a, b, c, and d Pharmacokinetic models illustrating the relative rise of cystatin C above baseline at different levels of glomerular filtration rate (GFR) in time. Course of calculated cystatin C concentrations following an acute decrease in GFR at time 24 h at two different levels of GFR. Presentation of the relative rise compared to baseline corresponds to a GFR of 100 ml/min/1.73 m2 (Fig. 3a and c) and a GFR of 50 ml/min/1.73 m2 (Fig. 3b and d). In Fig. 3c and d, the extrarenal elimination (ERE) of cystatin C (i.e., 22 ml/min/1.73 m2) is taken into account. For comparison, the relative rise of cystatin C calculated according to the Grubb equation is indicated in Fig. 3c and d
Fig. 4
Fig. 4
Model illustrating the effect of corticosteroids on the relative rise of cystatin C above baseline at different levels of glomerular filtration rate (GFR). Calculation of cystatin C concentrations correspond to three different baseline GFR levels and a decrease by 25% (RIFLE ‘R’) using the Grubb equation. Correction for the dose-dependent increase in serum cystatin C caused by glucocorticoids using the equation 1/cys = 0.0096 * GFR – 0.0023 * prednisone dose (mg/m2/day) [33]

References

    1. Perrone RD, Madias NE, Levey AS. Serum creatinine as an index of renal function: new insights into old concepts. Clin Chem. 1992;38:1933–1953. - PubMed
    1. Vinge E, Lindergard B, Nilsson-Ehle P, Grubb A. Relationships among serum cystatin C, serum creatinine, lean tissue mass and glomerular filtration rate in healthy adults. Scand J Clin Lab Invest. 1999;59:587–592. doi: 10.1080/00365519950185076. - DOI - PubMed
    1. Schwartz GJ, Brion LP, Spitzer A. The use of plasma creatinine concentration for estimating glomerular filtration rate in infants, children, and adolescents. Pediatr Clin North Am. 1987;34:571–590. - PubMed
    1. Bunchman TE, Fryd DS, Sibley RK, Mauer SM. Manifestations of renal allograft rejection in small children receiving adult kidneys. Pediatr Nephrol. 1990;4:255–258. doi: 10.1007/BF00857670. - DOI - PubMed
    1. Grubb AO. Cystatin C—properties and use as diagnostic marker. Adv Clin Chem. 2000;35:63–99. doi: 10.1016/S0065-2423(01)35015-1. - DOI - PMC - PubMed

Publication types