Review
. 2012 Jan;245(1):51-68.
doi: 10.1007/s00232-011-9412-4. Epub 2011 Dec 30.

Functions of cholesterol and the cholesterol bilayer domain specific to the fiber-cell plasma membrane of the eye lens

Affiliations
Review

Functions of cholesterol and the cholesterol bilayer domain specific to the fiber-cell plasma membrane of the eye lens

Witold K Subczynski et al. J Membr Biol. 2012 Jan.

Abstract

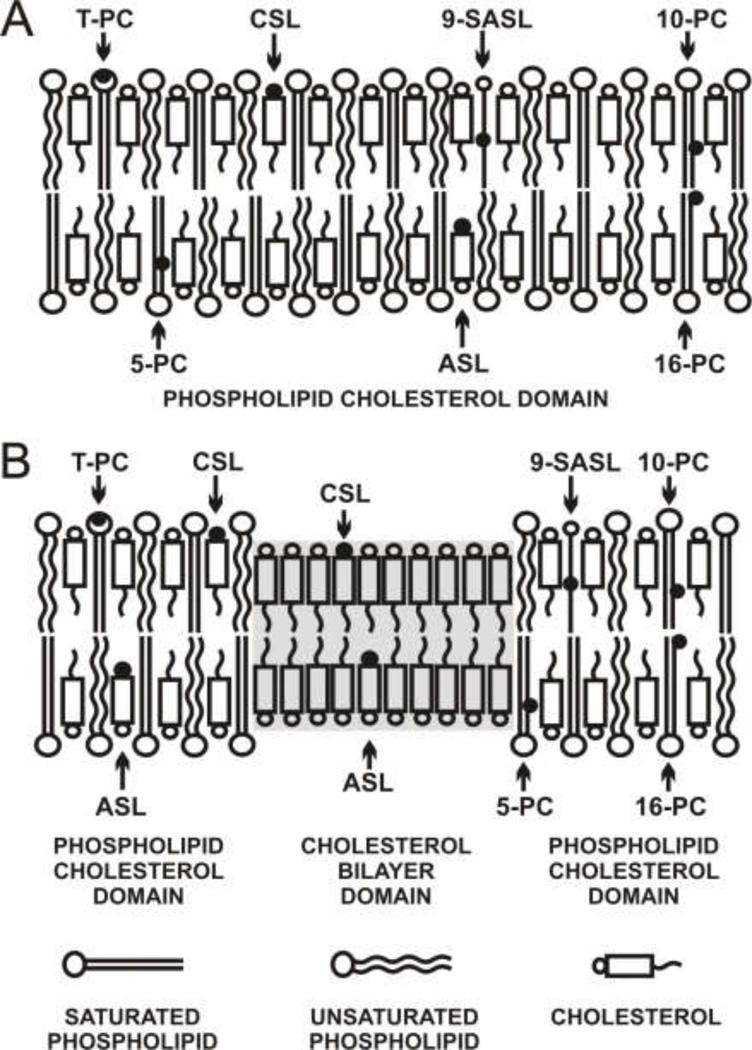
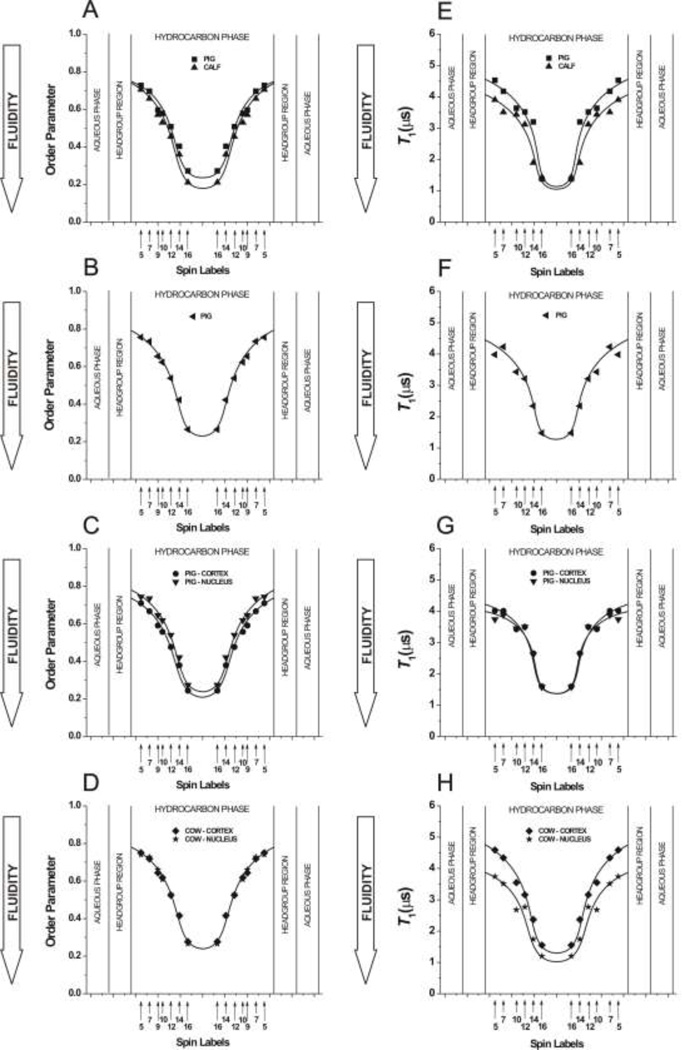
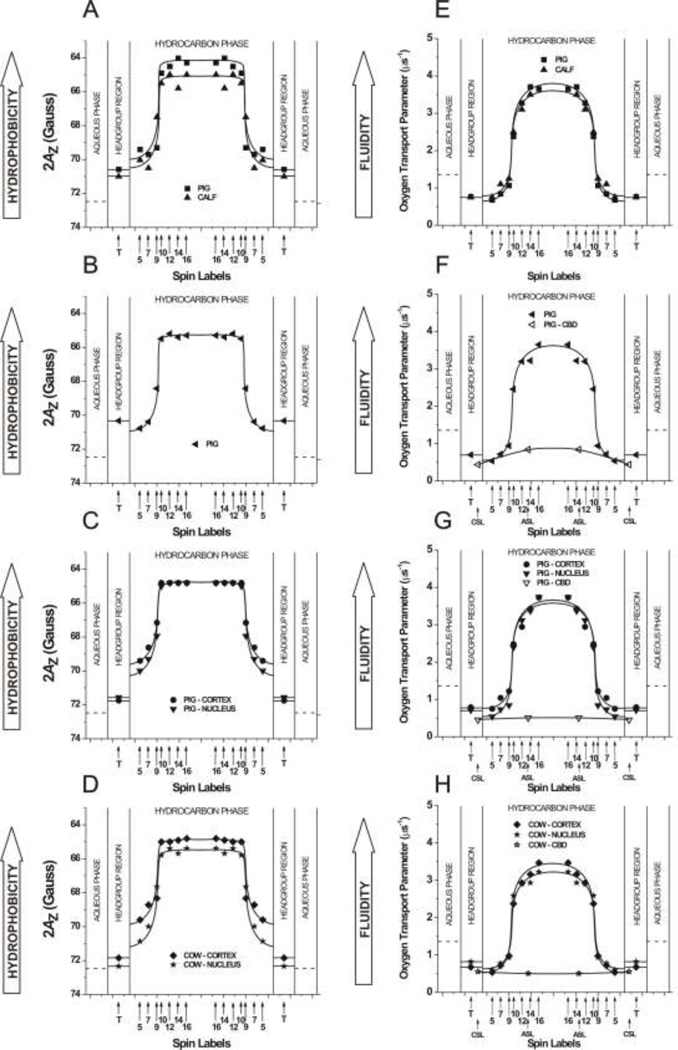
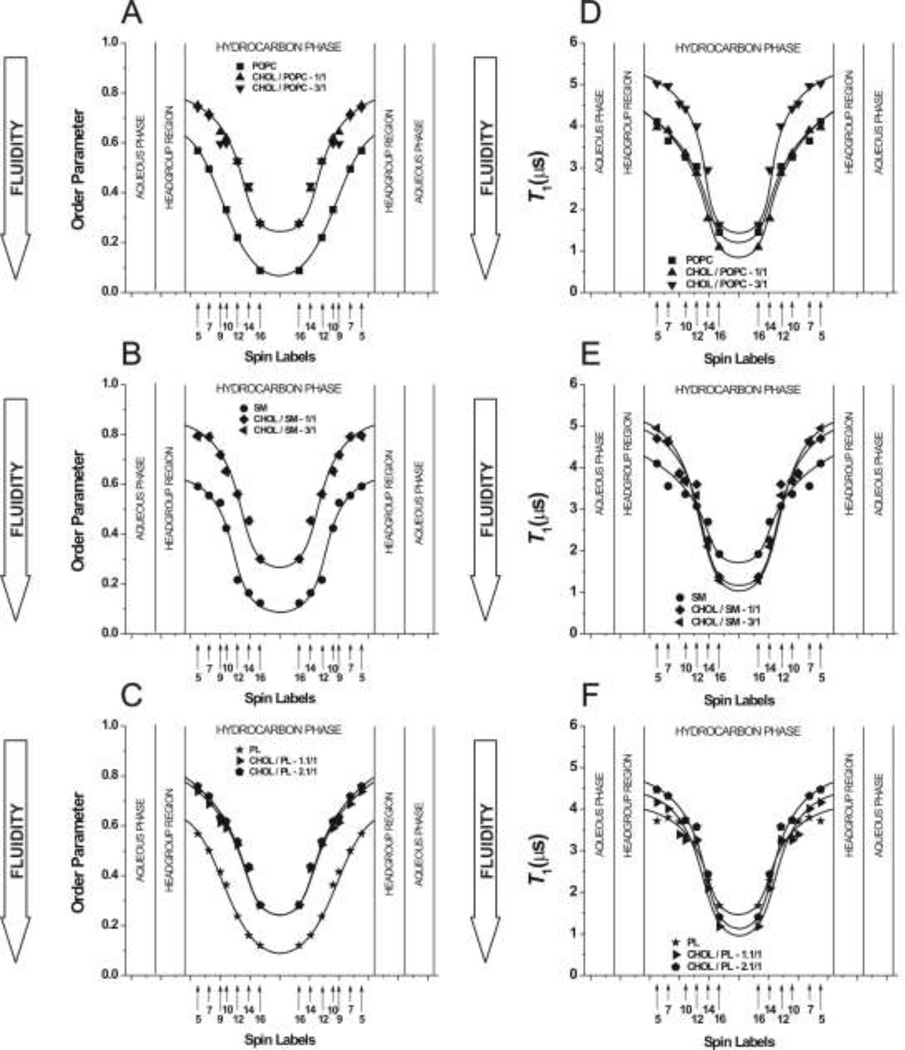
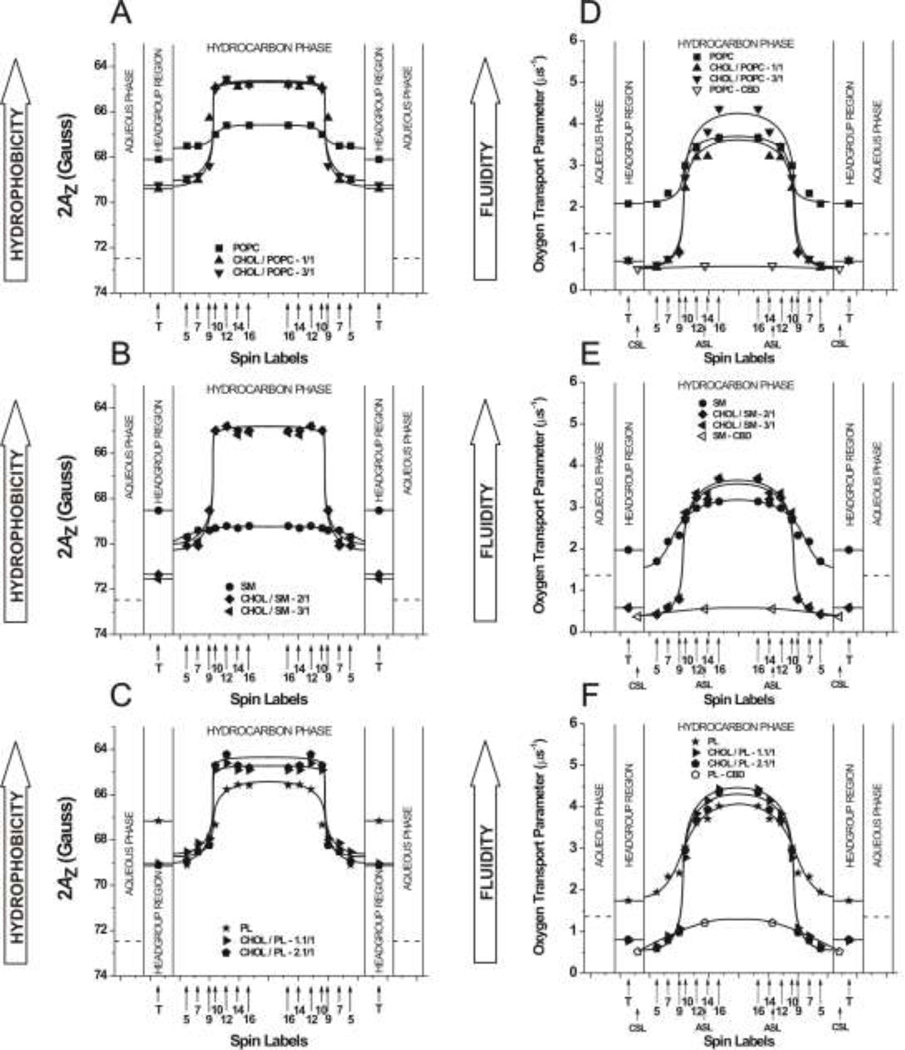
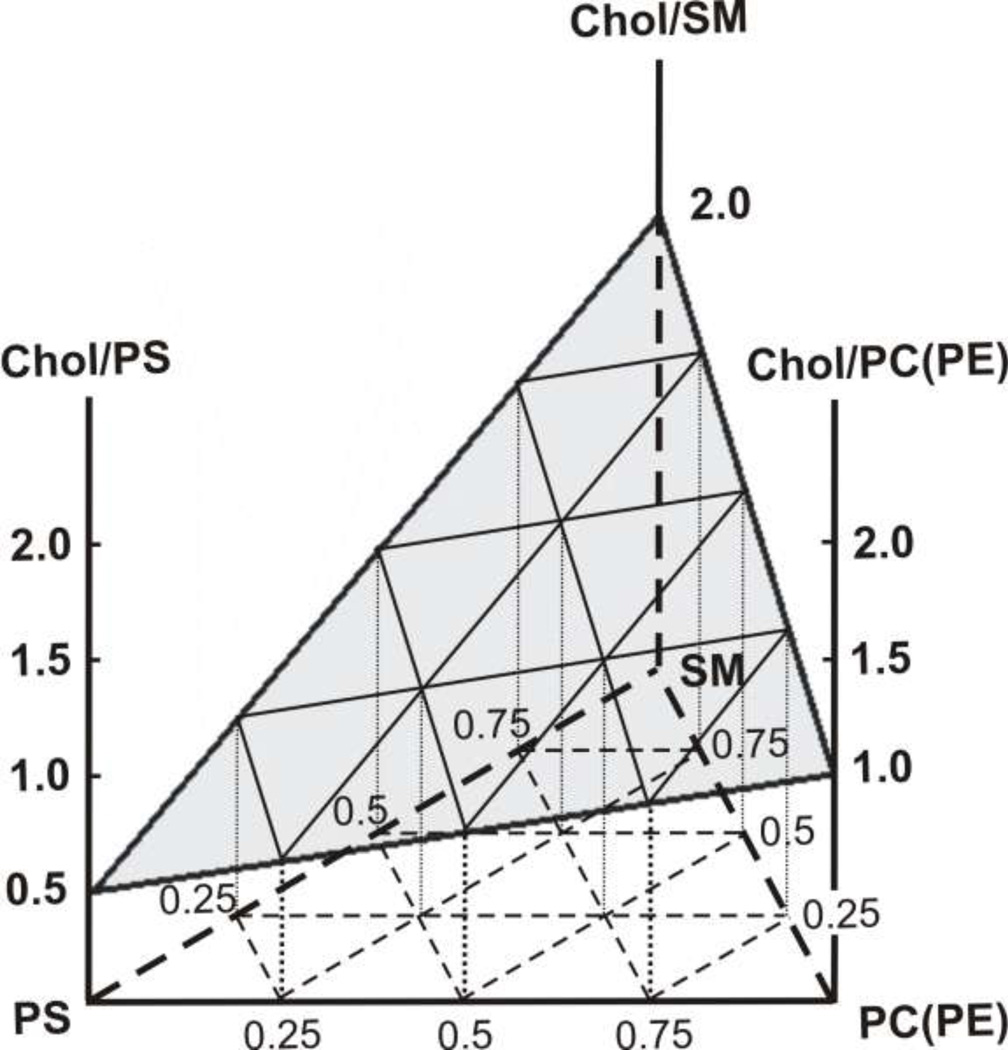
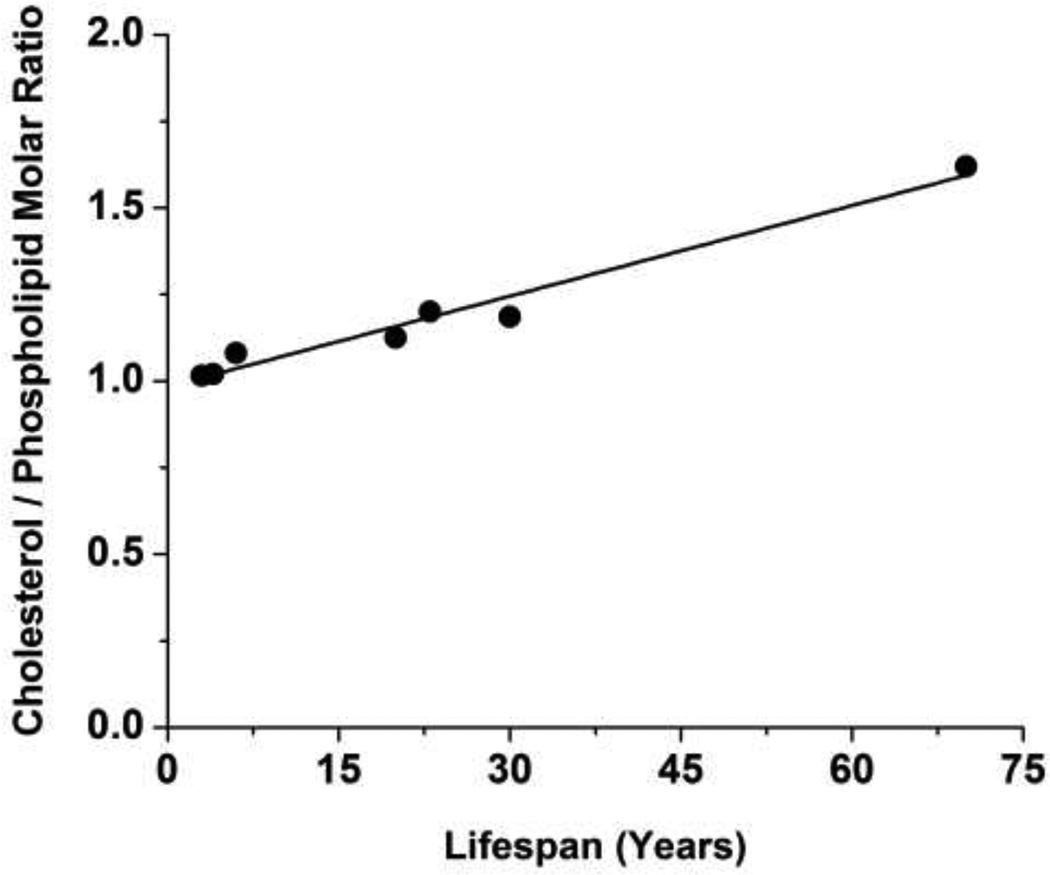
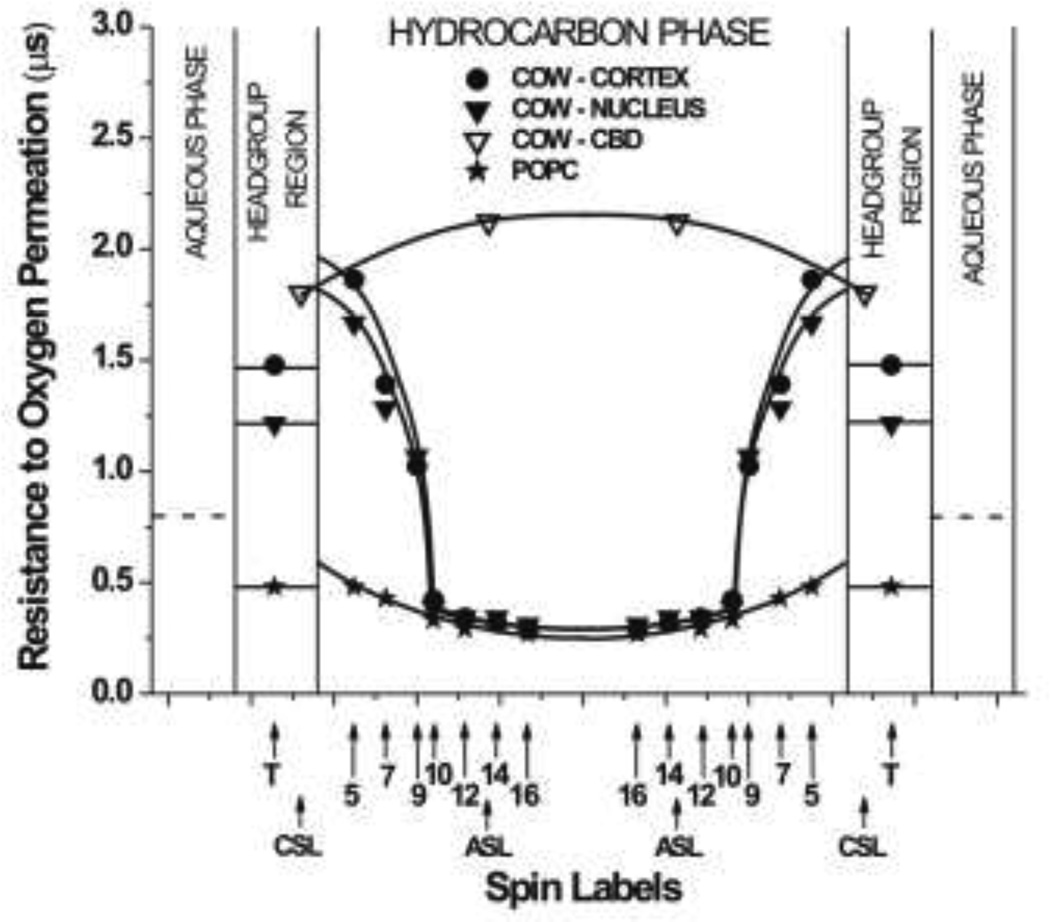
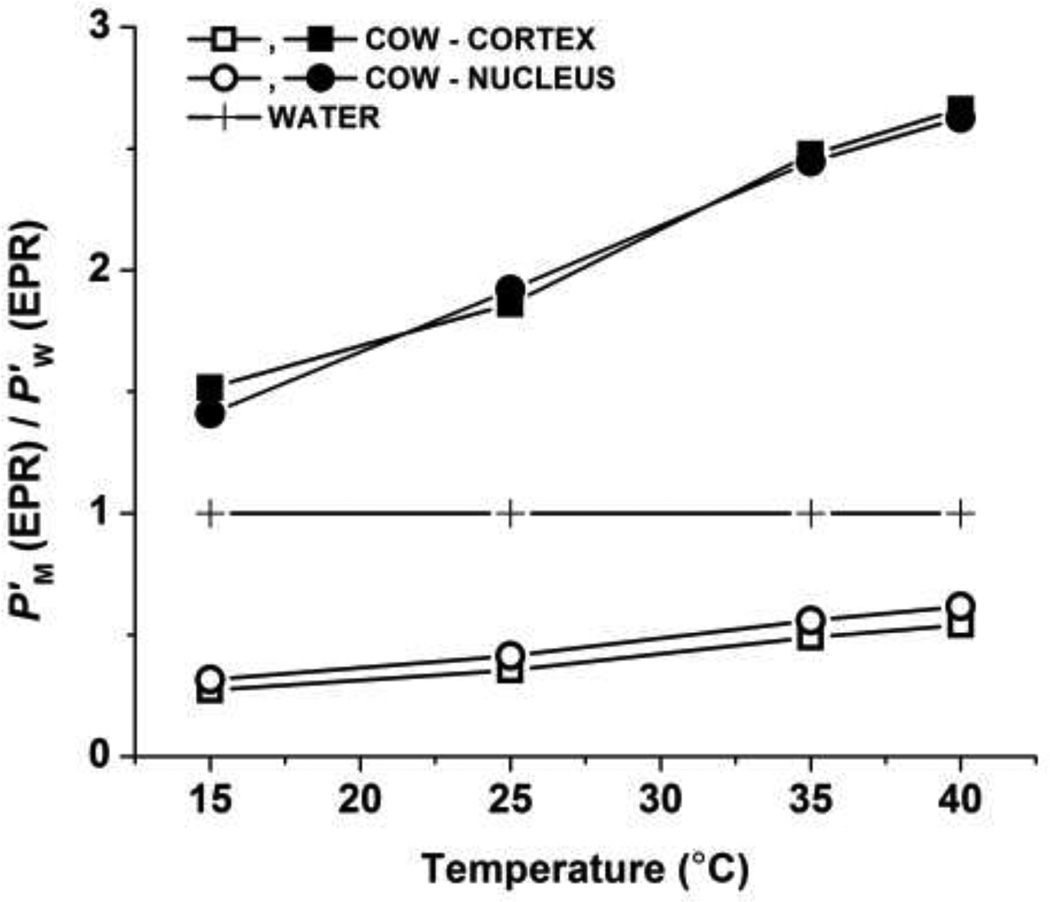
The most unique feature of the eye lens fiber-cell plasma membrane is its extremely high cholesterol content. Cholesterol saturates the bulk phospholipid bilayer and induces formation of immiscible cholesterol bilayer domains (CBDs) within the membrane. Our results (based on EPR spin-labeling experiments with lens-lipid membranes), along with a literature search, have allowed us to identify the significant functions of cholesterol specific to the fiber-cell plasma membrane, which are manifest through cholesterol-membrane interactions. The crucial role is played by the CBD. The presence of the CBD ensures that the surrounding phospholipid bilayer is saturated with cholesterol. The saturating cholesterol content in fiber-cell membranes keeps the bulk physical properties of lens-lipid membranes consistent and independent of changes in phospholipid composition. Thus, the CBD helps to maintain lens-membrane homeostasis when the membrane phospholipid composition changes significantly. The CBD raises the barrier for oxygen transport across the fiber-cell membrane, which should help to maintain a low oxygen concentration in the lens interior. It is hypothesized that the appearance of the CBD in the fiber-cell membrane is controlled by the phospholipid composition of the membrane. Saturation with cholesterol smoothes the phospholipid-bilayer surface, which should decrease light scattering and help to maintain lens transparency. Other functions of cholesterol include formation of hydrophobic and rigidity barriers across the bulk phospholipid-cholesterol domain and formation of hydrophobic channels in the central region of the membrane for transport of small, nonpolar molecules parallel to the membrane surface. In this review, we provide data supporting these hypotheses.


Figures

Fig. 1
Fig. 1
Diagram of the eye lens section showing the location of the lens cortex and nucleus. Values of the oxygen partial pressure at the surface of the anterior and posterior cortex of the lens in the healthy eye are taken from (Siegfried et al., 2010). Arrows indicate the oxygen flux into the lens, toward the lens center. The Chol/PL mole ratio in cortaical fiber cell membranes is from 1 to 2 and in nuclear membranes is from 3 to 4 (Li et al., 1987). The basic phospholipd composition (taken from (Yappert et al., 2003) for 25 year old human) of the cortical and nuclear lens lipid membrane is: 3.2% PC, 14% PE, 1.5% PS, and 42.8% (DHSM + SM) and 0.7 % PC, 6% PE, 3.1% PS, 49.8% (DHSM + SM), respectively (phosphatidylcholine [PC], phosphatidylethanolamine [PE], phosphatidylserine [PS], and sphingomyeline [SM, including dihydrosphingomyeline]).
Fig. 2
Fig. 2
Schematic drawings showing an organization of lipids and spin-label distributions that may be relevant to eye-lens lipid membranes. The distribution and approximate localization of the nitroxide moiety of lipid spin labels (phospholipid analogues, 5-, 10-, 16-, T-PC, and 9-SASL, and cholesterol analogues, ASL and CSL) in membranes with a cholesterol content close to the CST (A: a model of the lens lipid membrane from young animals and the cortical membrane) and in membranes oversaturated with cholesterol, when the bulk PCD coexists with the CBD (B: a model of the nuclear membrane). The nitroxide moieties of spin labels are indicated by black dots.
Fig. 3
Fig. 3
Independently of the differences in the phospholipid composition of lens lipid membranes derived from eyes of different species, different animal age, and different region of the lens, the profiles of the membrane order (the alkyl-chain order parameter) and the membrane dynamics (spin-lattice relaxation time) across these membranes are very similar. Profiles of the alkyl-chain order parameter (A,B,C,D) and the membrane fluidity (spin-lattice relaxation time, T1, for deoxygenated samples) (E,F,G,H) obtained at 35°C across the PCD of lens lipid membranes made of lipids extracted from a six-month-old pig and calf (A,E), a six-month-old pig after the addition of excess cholesterol (B,F), and from the cortex and nucleus of a two-year-old pig (C,G) and cow (D, H). Approximate localizations of the nitroxide moieties of spin labels are indicated by arrows. The order parameter is a measure of the amplitude of the wobbling motion of the alkyl-chain fragment to which the nitroxide moiety is attached (Hubbel & McConnell 1968), while T1 depends primarily on the rate of motion of the nitroxide moiety within the lipid bilayer and, thus, describes the dynamics of the membrane environment at a depth at which the nitroxide fragment is located (Mainali et al., 2011a). Data compiled from (Raguz et al., 2008; Raguz et al., 2009; Widomska et al., 2007a).
Fig. 4
Fig. 4
Independently of the differences in the phospholipid composition of lens lipid membranes, all these membranes have very similar shape of the hydrophobic barrier with hydrophobicity in the membrane center close to that of hexane ((ε = 2). Also profiles of the oxygen transport parameters are nearly identical with low oxygen transport close to the membrane surface and high oxygen transport in the membrane center. Hydrophobicity profiles (obtained at −165°C) (A–D) and profiles of the oxygen transport parameter (obtained at 35°C) (E–H) across the PCD of lens lipid membranes made of lipids extracted from a six-month-old pig and calf (A,E), from a six-month-old pig after the addition of cholesterol (B,F), and from the cortex and nucleus of a two-year-old pig (C,G) and cow (D, H). Profiles of the oxygen transport parameter across the CBD, which is formed in lens lipid membranes made of lipids extracted from a six-month-old pig after the addition of cholesterol (F), from the nucleus of a two-year-old pig (G), and a two-year-old cow (H), are also included. Broken lines indicate the appropriate value in the aqueous phase. Approximate localizations of nitroxide moieties of spin labels are indicated by arrows. Hydrophobicity profiles (2AZ) are obtained for frozen samples to eliminate the motional contribution. Smaller 2AZ values (upward changes in the profiles) indicate higher hydrophobicity. Usually, the local hydrophobicity as observed by 2AZ is related to the hydrophobicity (or, ε) of the bulk organic solvent by referring to Fig. 2 in Ref. (Subczynski et al., 1994). An oxygen transport parameter was introduced as a convenient quantitative measure of the collision rate between the spin label and molecular oxygen (Kusumi et al., 1982). It is useful to monitor membrane fluidity, which reports on translational diffusion of small molecules. The oxygen transport parameter is normalized to an oxygen concentration that corresponds to the sample equilibrated with atmospheric air. Data compiled from (Raguz et al., 2008; Raguz et al., 2009; Widomska et al., 2007a).
Fig. 5
Fig. 5
An ordering effect of the saturating amount of cholesterol is observed at all depths from the membrane surface to the membrane center. However, profiles of membrane dynamics reveal that cholesterol has a rigidifying effect only to the depth occupied by the rigid steroid-ring structure and a fluidizing effect at deeper locations. Profiles of the alkyl-chain order parameter (A–C) and membrane fluidity (spin-lattice relaxation time, T1, for deoxygenated samples) (D–F) obtained at 35°C across POPC membranes (A,D) without cholesterol (POPC) and with cholesterol at cholesterol/POPC mixing ratios of 1/1 (CHOL/POPC-1/1) and 3/1 (CHOL/POPC-3/1); across egg sphingomyelin (SM) membranes (B,E) without cholesterol (SM) and with cholesterol at cholesterol/SM mixing ratios of 2/1 (CHOL/SM-2/1) and 3/1 (CHOL/SM-3/1); and across model membranes made from a phospholipid mixture resembling the composition of the pig-lens lipid membrane (PL, 30% SM, 36% PC, 12% PE, 22% PS) (C,F) without cholesterol (PL), saturated with cholesterol at a cholesterol/PL mixing ratio of 1.1/1 (CHOL/PL-1.1/1), and oversaturated with cholesterol at a cholesterol/PL mixing ratio of 2.1/1 (CHOL/PL-2.1/1). Broken lines indicate the appropriate value in the aqueous phase. Approximate localizations of nitroxide moieties of spin labels are indicated by arrows. Data compiled from (Widomska et al., 2007a).
Fig. 6
Fig. 6
The saturating amount of cholesterol is responsible for changing the bell-shaped hydrophobicity and oxygen transport parameter profiles to the rectangular shape with an abrupt change between C9 and C10 positions, which is approximately where the rigid steroid-ring structure of cholesterol reaches into the membrane. Hydrophobicity profiles (obtained at −165°C) (A–C) and profiles of the oxygen transport parameter (obtained at 35°C) (D–F) across POPC membranes (A,D), SM membranes (B,E), and model membranes resembling the pig-lens lipid membrane (C,F) with different cholesterol contents (see the caption for Fig. 5 for details). Profiles are also included of the oxygen transport parameter across the CBD, which is formed in the POPC membrane, with a cholesterol/POPC mixing ratio of 3/1 (D, POPC-CBD); the egg sphingomyelin membrane with a cholesterol/SM mixing ratio of 3 (E, SM-CBD); and across model membranes resembling the pig-lens lipid membrane oversaturated with cholesterol at a cholesterol/PL mixing ratio of 2.1/1 (F, PL-CBD). Broken lines indicate the appropriate value in the aqueous phase. Approximate localizations of nitroxide moieties of spin labels are indicated by arrows. Data compiled from (Widomska et al., 2007a; Mainali et al., 2011b).
Fig. 7
Fig. 7
Hypothetical phase diagram for mixtures of the most abundant lens phospholipids (phosphatidylserine [PS], phosphatidylcholine [PC], phosphatidylethanolamine [PE], and sphingomyeline [SM, including dihydrosphingomyeline]) and cholesterol. The shaded surface indicates the CST for the mixture. For cholesterol contents above this cholesterol concentration, the CBD is formed. It is assumed that the CST value in the phospholipid mixture is a weighted sum of CSTs for individual phospholipids with a weight equal to the mole fraction of the individual phospholipid in the mixture. CSTs in PS, PC, PE, and SM membranes are taken from (Bach & Wachtel, 2003; Epand, 2003; Epand et al., 2002; Huang et al., 1999).
Fig. 8
Fig. 8
The relationship between the CST in the lens lipid membrane and the maximum life spans for different species. CSTs (above these cholesterol contents the CBD should be formed) for lens lipid membranes were evaluated based on the phospholipid compositions taken from Ref. (Deeley et al., 2008) and the phase diagram presented in Fig. 7. Points are for mouse (3), rat (4), chick (6), sheep (20), pig (23), cow (30), and human (70) (maximum lifespan values are indicated in parentheses).
Fig. 9
Fig. 9
Profiles of the resistance to oxygen permeation (the inverse of the oxygen transport parameter) across the PCD of lens lipid membranes made of lipids extracted from the cortex and nucleus of a two-year-old cow at 35°C are plotted to show the oxygen permeability barriers. The profile across the CBD that is formed in lens lipid membranes made of lipids extracted from a two-year-old cow is also included. To emphasize the effect of cholesterol, the profile of the resistance to oxygen permeation across the pure POPC membrane is shown. The resistance to oxygen permeation in the aqueous phase is indicated as a broken line. Oxygen transport parameter values were taken from Fig. 4H and 4D.
Fig. 10
Fig. 10
The permeability coefficient for oxygen across a specific membrane region (PM(EPR)) relative to that across a water layer of the same thickness as the membrane region (PW(EPR); i.e., PM(EPR)/PW(EPR)) for cortical (□,■) and nuclear (○,●) lens lipid membranes of a two-year-old cow plotted as a function of temperature. Both PM(EPR) and PW(EPR) were obtained by the EPR method. Symbols □,○ indicate the membrane region from the membrane surface to the depth of the ninth carbon (measurements with T-PC, 5-PC, 7-PC, and 9-SASL), and symbols ■,● indicate the membrane region between the tenth carbons in each membrane leaflet (measurements with 10-, 12-, 14-, and 16-PC).

Similar articles

Cited by

References

    1. Altenbach C, Greenhalgh DA, Khorana HG, Hubbell WL. A collision gradient method to determine the immersion depth of nitroxides in lipid bilayers: application to spin-labeled mutants of bacteriorhodopsin. Proc Natl Acad Sci U S A. 1994;91:1667–1671. - PMC - PubMed
    1. Ashikawa I, Yin J-J, Subczynski WK, Kouyama T, Hyde JS, Kusumi A. Molecular organization and dynamics in bacteriorhodopsin-rich reconstituted membranes: discrimination of lipid environments by the oxygen transport parameter using a pulse ESR spin-labeling technique. Biochemistry. 1994;33:4947–4952. - PubMed
    1. Bach D, Wachtel E. Phospholipid/cholesterol model membranes: formation of cholesterol crystallites. Biochim Biophys Acta. 2003;1610:187–197. - PubMed
    1. Barbazetto IA, Liang J, Chang S, Zheng L, Spector A, Dillon JP. Oxygen tension in the rabbit lens and vitreous before and after vitrectomy. Exp Eye Res. 2004;78:917–924. - PubMed
    1. Bassnett S, McNulty R. The effect of elevated intraocular oxygen on organelle degradation in the embryonic chicken lens. J Exp Biol. 2003;206:4353–4361. - PubMed

Publication types