

Ultraconserved elements are novel phylogenomic markers that resolve placental mammal phylogeny when combined with species-tree analysis
- PMID: 22207614
- PMCID: PMC3317156
- DOI: 10.1101/gr.125864.111
Ultraconserved elements are novel phylogenomic markers that resolve placental mammal phylogeny when combined with species-tree analysis
Abstract
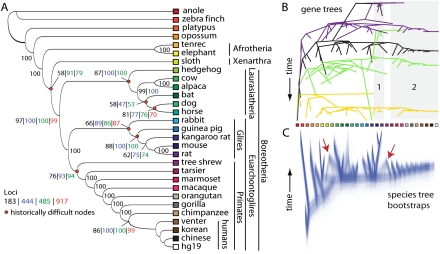
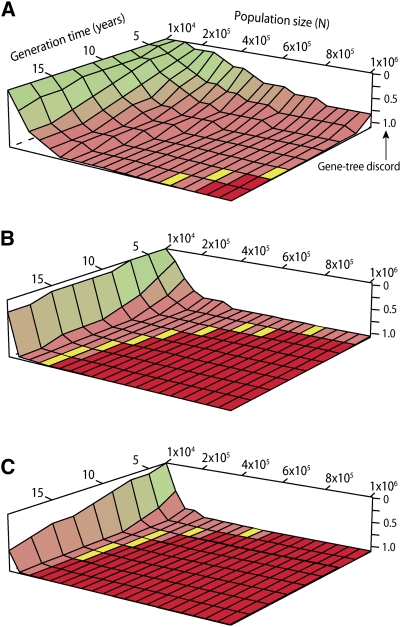
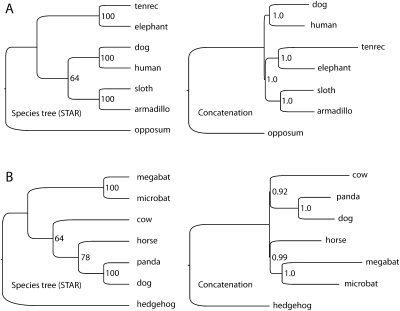
Phylogenomics offers the potential to fully resolve the Tree of Life, but increasing genomic coverage also reveals conflicting evolutionary histories among genes, demanding new analytical strategies for elucidating a single history of life. Here, we outline a phylogenomic approach using a novel class of phylogenetic markers derived from ultraconserved elements and flanking DNA. Using species-tree analysis that accounts for discord among hundreds of independent loci, we show that this class of marker is useful for recovering deep-level phylogeny in placental mammals. In broad outline, our phylogeny agrees with recent phylogenomic studies of mammals, including several formerly controversial relationships. Our results also inform two outstanding questions in placental mammal phylogeny involving rapid speciation, where species-tree methods are particularly needed. Contrary to most phylogenomic studies, our study supports a first-diverging placental mammal lineage that includes elephants and tenrecs (Afrotheria). The level of conflict among gene histories is consistent with this basal divergence occurring in or near a phylogenetic "anomaly zone" where a failure to account for coalescent stochasticity will mislead phylogenetic inference. Addressing a long-standing phylogenetic mystery, we find some support from a high genomic coverage data set for a traditional placement of bats (Chiroptera) sister to a clade containing Perissodactyla, Cetartiodactyla, and Carnivora, and not nested within the latter clade, as has been suggested recently, although other results were conflicting. One of the most remarkable findings of our study is that ultraconserved elements and their flanking DNA are a rich source of phylogenetic information with strong potential for application across Amniotes.
Figures

Similar articles
-
Investigating Difficult Nodes in the Placental Mammal Tree with Expanded Taxon Sampling and Thousands of Ultraconserved Elements.Genome Biol Evol. 2017 Sep 1;9(9):2308-2321. doi: 10.1093/gbe/evx168. Genome Biol Evol. 2017. PMID: 28934378 Free PMC article.
-
Less is more in mammalian phylogenomics: AT-rich genes minimize tree conflicts and unravel the root of placental mammals.Mol Biol Evol. 2013 Sep;30(9):2134-44. doi: 10.1093/molbev/mst116. Epub 2013 Jun 29. Mol Biol Evol. 2013. PMID: 23813978
-
The gene tree delusion.Mol Phylogenet Evol. 2016 Jan;94(Pt A):1-33. doi: 10.1016/j.ympev.2015.07.018. Epub 2015 Jul 31. Mol Phylogenet Evol. 2016. PMID: 26238460
-
Mammal madness: is the mammal tree of life not yet resolved?Philos Trans R Soc Lond B Biol Sci. 2016 Jul 19;371(1699):20150140. doi: 10.1098/rstb.2015.0140. Philos Trans R Soc Lond B Biol Sci. 2016. PMID: 27325836 Free PMC article. Review.
-
Implementing and testing the multispecies coalescent model: A valuable paradigm for phylogenomics.Mol Phylogenet Evol. 2016 Jan;94(Pt A):447-62. doi: 10.1016/j.ympev.2015.10.027. Epub 2015 Oct 27. Mol Phylogenet Evol. 2016. PMID: 26518740 Review.
Cited by
-
In silico phylogenomics using complete genomes: a case study on the evolution of hominoids.Genome Res. 2016 Sep;26(9):1257-67. doi: 10.1101/gr.203950.115. Epub 2016 Jul 19. Genome Res. 2016. PMID: 27435933 Free PMC article.
-
Targeted capture in evolutionary and ecological genomics.Mol Ecol. 2016 Jan;25(1):185-202. doi: 10.1111/mec.13304. Epub 2015 Jul 30. Mol Ecol. 2016. PMID: 26137993 Free PMC article. Review.
-
MitoFinder: Efficient automated large-scale extraction of mitogenomic data in target enrichment phylogenomics.Mol Ecol Resour. 2020 Jul;20(4):892-905. doi: 10.1111/1755-0998.13160. Epub 2020 Apr 25. Mol Ecol Resour. 2020. PMID: 32243090 Free PMC article.
-
Whole-genome Analyses Reveal Past Population Fluctuations and Low Genetic Diversities of the North Pacific Albatrosses.Mol Biol Evol. 2023 Jul 3;40(7):msad155. doi: 10.1093/molbev/msad155. Mol Biol Evol. 2023. PMID: 37402641 Free PMC article.
-
A Phylogenomic Approach Based on PCR Target Enrichment and High Throughput Sequencing: Resolving the Diversity within the South American Species of Bartsia L. (Orobanchaceae).PLoS One. 2016 Feb 1;11(2):e0148203. doi: 10.1371/journal.pone.0148203. eCollection 2016. PLoS One. 2016. PMID: 26828929 Free PMC article.
References
-
- Bejerano G, Pheasant M, Makunin I, Stephen S, Kent W, Mattick J, Haussler D 2004. Ultraconserved elements in the human genome. Science 304: 1321. - PubMed
-
- Bininda-Emonds ORP, Cardillo M, Jones KE, MacPhee RDE, Beck RMD, Grenyer R, Price SA, Vos RA, Gittleman JL, Purvis A 2007. The delayed rise of present-day mammals. Nature 446: 507–512 - PubMed
-
- Bouckaert RR 2010. DensiTree: Making sense of sets of phylogenetic trees. Bioinformatics 26: 1372–1373 - PubMed
MeSH terms
Substances
LinkOut - more resources
Full Text Sources
Other Literature Sources
Molecular Biology Databases