. 2012 Mar;63(5):2171-87.
doi: 10.1093/jxb/err447. Epub 2011 Dec 29.

Transcript and protein profiling analysis of OTA-induced cell death reveals the regulation of the toxicity response process in Arabidopsis thaliana

Affiliations

Transcript and protein profiling analysis of OTA-induced cell death reveals the regulation of the toxicity response process in Arabidopsis thaliana

Yan Wang et al. J Exp Bot. 2012 Mar.

Abstract

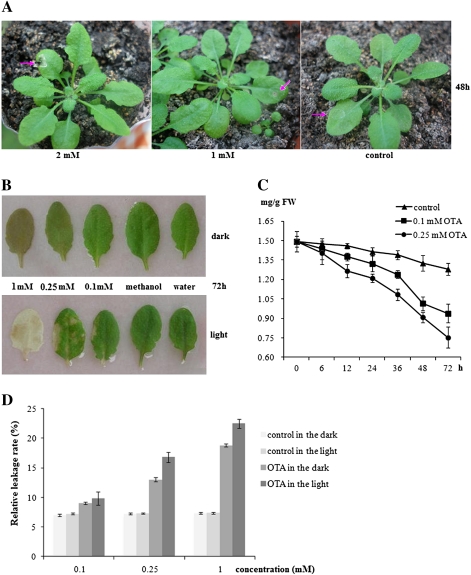
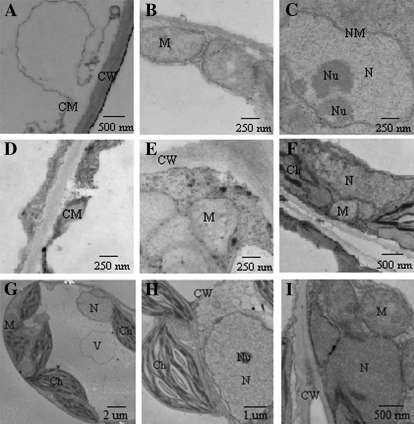
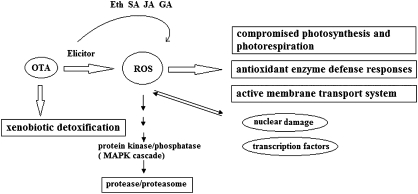
Ochratoxin A (OTA) is a toxic isocoumarin derivative produced by various species of mould which mainly grow on grain, coffee, and nuts. Recent studies have suggested that OTA induces cell death in plants. To investigate possible mechanisms of OTA phytotoxicity, both digital gene expression (DGE) transcriptomic and two-dimensional electrophoresis proteomic analyses were used, through which 3118 genes and 23 proteins were identified as being up- or down-regulated at least 2-fold in Arabidopsis leaf in response to OTA treatment. First, exposure of excised Arabidopsis thaliana leaves to OTA rapidly causes the hypersensitive reponse, significantly accelerates the increase of reactive oxygen species and malondialdehyde, and enhances antioxidant enzyme defence responses and xenobiotic detoxification. Secondly, OTA stimulation causes dynamic changes in transcription factors and activates the membrane transport system dramatically. Thirdly, a concomitant persistence of compromised photosynthesis and photorespiration is indicative of a metabolic shift from a highly active to a weak state. Finally, the data revealed that ethylene, salicylic acid, jasmonic acid, and mitogen-activated protein kinase signalling molecules mediate the process of toxicity caused by OTA. Profiling analyses on Arabidopsis in response to OTA will provide new insights into signalling transduction that modulates the OTA phytotoxicity mechanism, facilitate mapping of regulatory networks, and extend the ability to improve OTA tolerance in Arabidopsis.


Figures

Fig. 1.
Fig. 1.
Development of necrotic lesions and ultrastructural changes during OTA treatment. (A and B) Development of OTA-dependent necrotic lesions in leaves of 4-week-old Arabidopsis thaliana. The leaves were infiltrated with a series of OTA concentrations or methanol (control) and photographed at the indicated times. (C) Chlorosis of leaves was observed during the time course after 40 μM, 0.1 mM, or 0.25 mM OTA treatment; the curve indicates the change in average chlorophyll content relative to the control at time zero. (D) The relative leakage rate in response to OTA at 0.1, 0.25, and 1 mM under dark and light conditions in Arabidopsis leaves (n=3). (This figure is available in colour at JXB online.)
Fig. 2.
Fig. 2.
Ultrastructural changes in the mesophyll cells in Arabidopsis leaves induced by OTA. (A–C) Transmission electron micrographs of samples from leaves floating in 0.25 mM OTA for 8 h under continuous light. (A) The separation of plasma membrane from the cell wall and the formation of folds. (B) The membrane of mitochondria became unclear. (C) The agglutination of chromatin and the margination and breaking of the nucleolus. (D–F) Transmission electron micrographs of samples from leaves floating in 0.25 mM OTA for 24 h under continuous light. (D) The thickness of the membrane was uneven, and some membrane sections split. (E) Mitochondria deformed, and the matrix escaped. (F) The nucleus was out of shape. (G–I) Transmission electron micrographs of samples from leaves incubated in an equal volume of methanol for 3, 8, and 24 h under continuous light. CW, cell wall; Ch, chloroplast; M, mitochondria; N, nucleus; NM; nucleus membrane; Nu, nucleolus; V, vacuole.
Fig. 3.
Fig. 3.
Real-time PCR analyses of the selected genes, encoding ascorbate peroxidase APX, the salicylic acid-dependent defence-related gene PR1, aminocyclopropane carboxylate synthase ACS6, AtrbohC, AtrbohD, and the internal reference gene Actin2. Four-week-old Arabidopsis leaves were treated with 0.25 mM OTA for 3, 8, and 24 h, and the control was treated with an equal volume of methanol. Samples were harvested after treatment, and gene expression was measured by quantitative RT-PCR. mRNA and Actin2 were detected by agarose gel electrophoresis, as shown on the left, and relative gene expression ratios (under control treatment) are shown on the right. Standard errors of the mean are shown (n=3).
Fig. 4.
Fig. 4.
(A) ROS content measured by H2DCFDA fluorescence (n=3). (B) Lipid peroxidation. MDA content was determined as described in the Materials and methods (n=3). (C) The photosynthetic activity (Pn) was detected using the LI-6400XT photosynthetic system (n=3). OTA, 0.1 mM, 0.25 mM, 1 mM, Control, an equal volume of methanol.
Fig. 5.
Fig. 5.
Images of the 2D gels of total proteins of Arabidopsis leaves infected with OTA and methanol (control). Arabidopsis leaves were treated with 0.25 mM OTA or methanol solution (control) under continuous light at room temperature (22 °C) for 8 h. Proteins were extracted from Arabidopsis leaves with protein extraction buffer by sonication, as described in the Materials and methods. Total protein (400 μg) was separated on 2D gels (pH 3–10 NL) and stained with colloidal Coomassie Brilliant Blue R-250. Arrows indicate proteins that are differentially expressed under OTA stress. The protein spots are numbered, corresponding to the numbers in Table 1. (This figure is available in colour at JXB online.)
Fig. 6.
Fig. 6.
The most regulated genes were classified by Gene Ontology (GO): cell component (A), molecular function (B), and biological process (C). (This figure is available in colour at JXB online.)
Fig. 7.
Fig. 7.
Real-time PCR analyses of the genes CRN1, CAB, SHM1, PGK, PsbP-1, AnnAt1, and the internal reference gene Actin2. Gene expression ratios (relative to the control treatment) are shown. Standard errors of the mean are shown (n=3).
Fig. 8.
Fig. 8.
Hypothetical model of the regulatory network in response to OTA in Arabidopsis leaf cells.

Similar articles

Cited by

References

    1. Anderson JW, Rowan KS. Activity of peptidase in tobacco-leaf tissue in relation to senescence. Biochemical Journal. 1965;97:7461–7466. - PMC - PubMed
    1. Audic S, Claverie JM. The significance of digital gene expression profiles. Genome Research. 1997;7:986–995. - PubMed
    1. Bednarek P, Piślewska-Bednarek M, Svatoš A, et al. A glucosinolate metabolism pathway in living plant cells mediates broad-spectrum antifungal defense. Science. 2009;323:101–106. - PubMed
    1. Bennett J. Mycotoxins. Clinical Microbiology Reviews. 2003;16:497–516. - PMC - PubMed
    1. Boesch-Saadatmandi C, Loboda A, Jozkowicz A, Huebbe P, Blank R, Wolffram S, Dulak J, Rimbach G. Effect of ochratoxin A on redox-regulated transcription factors, antioxidant enzymes and glutathione-S-transferase in cultured kidney tubulus cells. Food and Chemical Toxicology. 2008;46:2665–2671. - PubMed

Publication types

MeSH terms