

Suppression of tumour-specific CD4⁺ T cells by regulatory T cells is associated with progression of human colorectal cancer
- PMID: 22207629
- PMCID: PMC3388728
- DOI: 10.1136/gutjnl-2011-300970
Suppression of tumour-specific CD4⁺ T cells by regulatory T cells is associated with progression of human colorectal cancer
Abstract
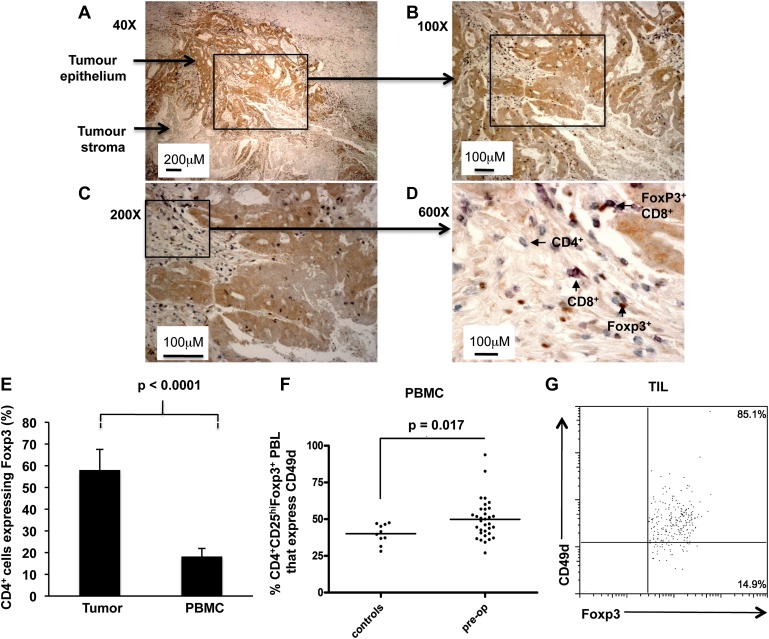
Background: There is indirect evidence that T cell responses can control the metastatic spread of colorectal cancer (CRC). However, an enrichment of CD4(+)Foxp3(+) regulatory T cells (Tregs) has also been documented.
Objective: To evaluate whether CRC promotes Treg activity and how this influences anti-tumour immune responses and disease progression.
Methods: A longitudinal study of Treg activity on a cohort of patients was performed before and after tumour resection. Specific CD4(+) T cell responses were also measured to the tumour associated antigens carcinoembryonic antigen (CEA) and 5T4.
Results: Tregs from 62 preoperative CRC patients expressed a highly significant increase in levels of Foxp3 compared to healthy age-matched controls (p=0.007), which returned to normal after surgery (p=0.0075). CD4(+) T cell responses to one or both of the tumour associated antigens, CEA and 5T4, were observed in approximately two-thirds of patients and one third of these responses were suppressed by Tregs. Strikingly, in all patients with tumour recurrence at 12 months, significant preoperative suppression was observed of tumour-specific (p=0.003) but not control CD4(+) T cell responses.
Conclusion: These findings demonstrate that the presence of CRC drives the activity of Tregs and accompanying suppression of CD4(+) T cell responses to tumour-associated antigens. Suppression is associated with recurrence of tumour at 12 months, implying that Tregs contribute to disease progression. These findings offer a rationale for the manipulation of Tregs for therapeutic intervention.
Conflict of interest statement
Figures


Similar articles
-
Identification of CD8+CD25+Foxp3+ suppressive T cells in colorectal cancer tissue.Gut. 2009 Apr;58(4):520-9. doi: 10.1136/gut.2008.158824. Epub 2008 Nov 20. Gut. 2009. PMID: 19022917
-
CD4+CD25+FOXP3+ regulatory T cells suppress anti-tumor immune responses in patients with colorectal cancer.PLoS One. 2006 Dec 27;1(1):e129. doi: 10.1371/journal.pone.0000129. PLoS One. 2006. PMID: 17205133 Free PMC article.
-
T cell subpopulations in lymph nodes may not be predictive of patient outcome in colorectal cancer.J Exp Clin Cancer Res. 2011 Aug 24;30(1):78. doi: 10.1186/1756-9966-30-78. J Exp Clin Cancer Res. 2011. PMID: 21864372 Free PMC article.
-
FOXP3+ Tregs: heterogeneous phenotypes and conflicting impacts on survival outcomes in patients with colorectal cancer.Immunol Res. 2015 Mar;61(3):338-47. doi: 10.1007/s12026-014-8616-y. Immunol Res. 2015. PMID: 25608795 Review.
-
CD4+CD25+ regulatory T cells in tumor immunity.Int Immunopharmacol. 2016 May;34:244-249. doi: 10.1016/j.intimp.2016.03.009. Epub 2016 Mar 16. Int Immunopharmacol. 2016. PMID: 26994448 Review.
Cited by
-
Dysregulated Forkhead Box (FOX) Genes Association with Survival Prognosis, Anti-tumor Immunity, and Key Targeting Drugs in Colon Adenocarcinoma.Arch Iran Med. 2023 Sep 1;26(9):510-528. doi: 10.34172/aim.2023.77. Arch Iran Med. 2023. PMID: 38310407 Free PMC article.
-
Vitamin D3 Supplementation Promotes Regulatory T-Cells to Maintain Immune Homeostasis After Surgery for Early Stages of Colorectal Cancer.In Vivo. 2023 Jan-Feb;37(1):286-293. doi: 10.21873/invivo.13078. In Vivo. 2023. PMID: 36593062 Free PMC article. Clinical Trial.
-
Systematic Multiomic Analysis of Ly75 Gene Expression and Its Prognostic Value Through the Infiltration of Natural Killer (NK) Cells in Skin Cutaneous Melanoma.J Clin Med. 2020 May 8;9(5):1383. doi: 10.3390/jcm9051383. J Clin Med. 2020. PMID: 32397120 Free PMC article.
-
The relative change in regulatory T cells / T helper lymphocytes ratio as parameter for prediction of therapy efficacy in metastatic colorectal cancer patients.Oncotarget. 2017 Nov 21;8(65):109079-109093. doi: 10.18632/oncotarget.22606. eCollection 2017 Dec 12. Oncotarget. 2017. PMID: 29312592 Free PMC article.
-
B7-H1 expression is associated with poor prognosis in colorectal carcinoma and regulates the proliferation and invasion of HCT116 colorectal cancer cells.PLoS One. 2013 Oct 4;8(10):e76012. doi: 10.1371/journal.pone.0076012. eCollection 2013. PLoS One. 2013. PMID: 24124529 Free PMC article.
References
-
- Galon J, Costes A, Sanchez-Cabo F, et al. Type, density, and location of immune cells within human colorectal tumors predict clinical outcome. Science 2006;313:1960–4 - PubMed
-
- Hole N, Stern PL. Isolation and characterization of 5T4, a tumour-associated antigen. Int J Cancer 1990;45:179–84 - PubMed
-
- Hammarstrom S. The carcinoembryonic antigen (CEA) family: structures, suggested functions and expression in normal and malignant tissues. Semin Cancer Biol 1999;9:67–81 - PubMed
Publication types
MeSH terms
Substances
Grants and funding
LinkOut - more resources
Full Text Sources
Other Literature Sources
Medical
Research Materials