

The RANKL distal control region is required for the increase in RANKL expression, but not the bone loss, associated with hyperparathyroidism or lactation in adult mice
- PMID: 22207718
- PMCID: PMC3275157
- DOI: 10.1210/me.2011-1149
The RANKL distal control region is required for the increase in RANKL expression, but not the bone loss, associated with hyperparathyroidism or lactation in adult mice
Abstract
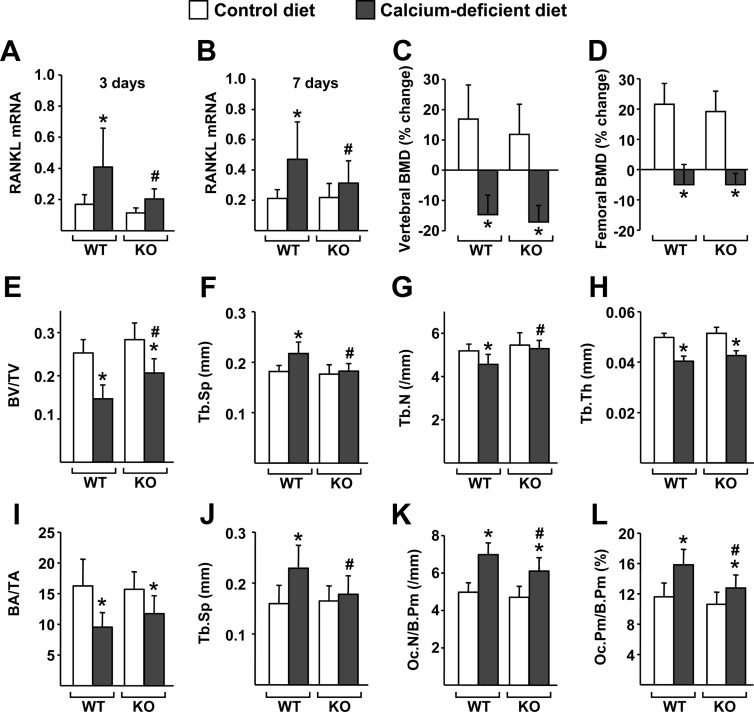
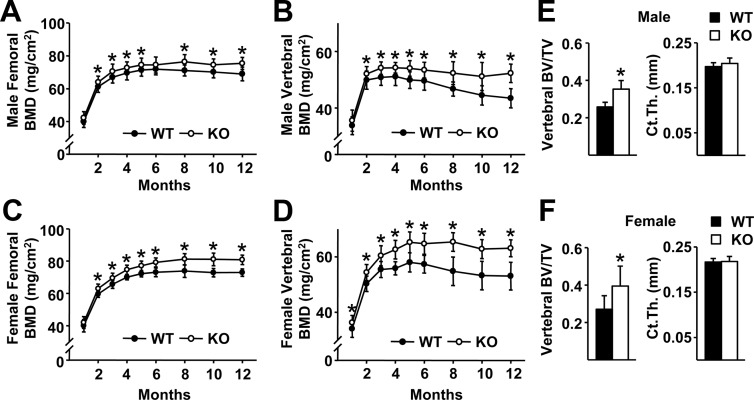
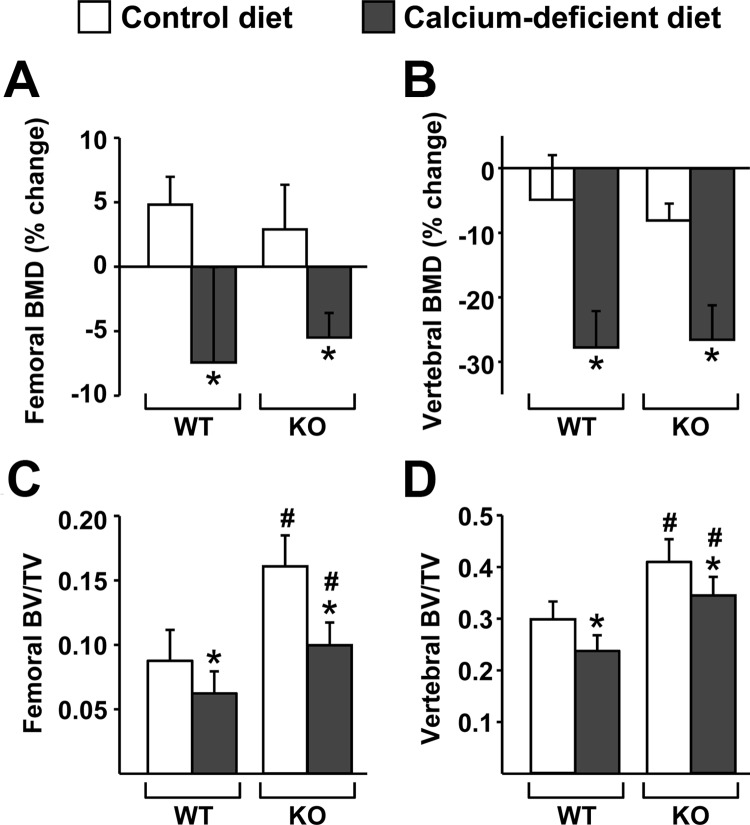
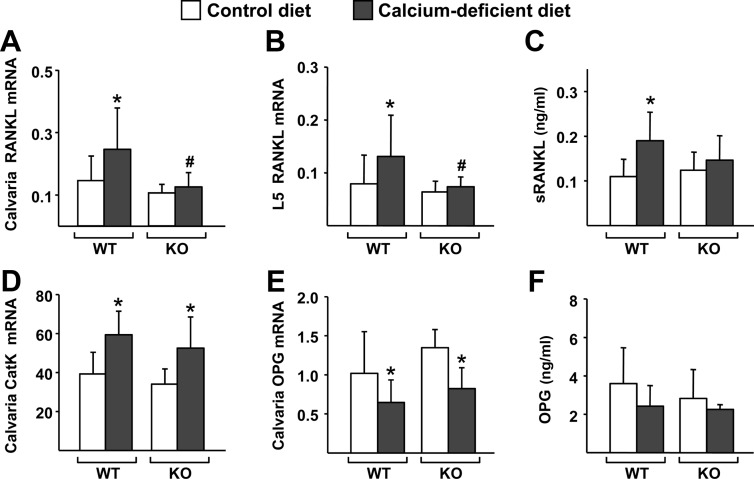
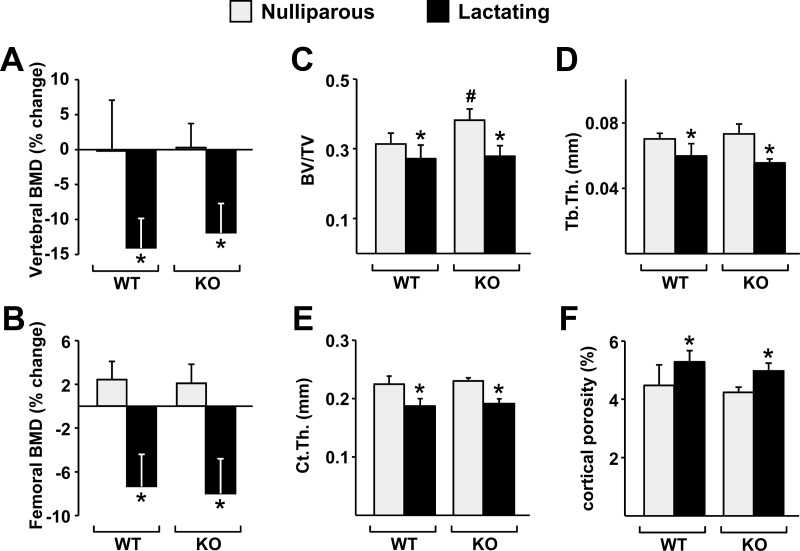
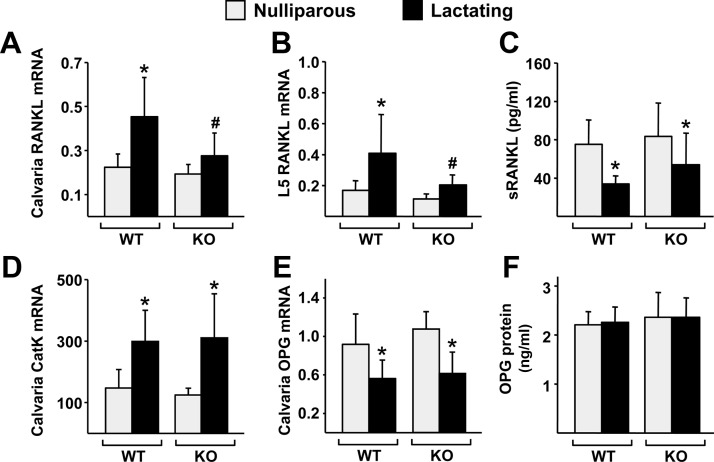
Osteoclast-mediated bone resorption plays an essential role in calcium homeostasis and lactation. The cytokine receptor activator of nuclear factor κB ligand (RANKL) is one of a number of factors that controls the production, survival, and activity of osteoclasts. Calciotropic hormones, such as PTH, control RANKL transcription in part via an enhancer known as the distal control region (DCR), and mice lacking this enhancer have fewer osteoclasts under normal physiological conditions. Here, we have addressed the role of the DCR in situations in which activation of the PTH receptor is thought to stimulate bone resorption via elevation of RANKL expression. Dietary calcium deficiency stimulated RANKL expression in the bone of young (1 month old) wild-type, but not DCR knockout (KO), mice. Consistent with this, the cancellous bone loss and the increase in osteoclasts caused by dietary calcium deficiency were blunted in young KO mice. DCR deletion also prevented the increase in RANKL expression caused by dietary calcium deficiency in 6-month-old mice. However, the diet-induced bone loss was similar in wild-type and KO mice at this age. The increase in RANKL expression caused by lactation was also blunted in DCR KO mice, but lactation-induced bone loss was similar in both genotypes. These results demonstrate that, even though the DCR is required for the increase in RANKL expression associated with hyperparathyroidism or lactation, this increase is not required for the bone loss caused by these conditions in adult mice, suggesting that changes in other factors, such as osteoprotegerin or estrogen levels, play a dominant role.
Figures
Similar articles
-
Osteocyte-derived RANKL is a critical mediator of the increased bone resorption caused by dietary calcium deficiency.Bone. 2014 Sep;66:146-54. doi: 10.1016/j.bone.2014.06.006. Epub 2014 Jun 14. Bone. 2014. PMID: 24933342 Free PMC article.
-
Targeted deletion of a distant transcriptional enhancer of the receptor activator of nuclear factor-kappaB ligand gene reduces bone remodeling and increases bone mass.Endocrinology. 2008 Jan;149(1):146-53. doi: 10.1210/en.2007-0734. Epub 2007 Oct 11. Endocrinology. 2008. PMID: 17932217 Free PMC article.
-
Deletion of the Distal Tnfsf11 RL-D2 Enhancer That Contributes to PTH-Mediated RANKL Expression in Osteoblast Lineage Cells Results in a High Bone Mass Phenotype in Mice.J Bone Miner Res. 2016 Feb;31(2):416-29. doi: 10.1002/jbmr.2698. J Bone Miner Res. 2016. PMID: 26332516 Free PMC article.
-
IL-6 is not required for parathyroid hormone stimulation of RANKL expression, osteoclast formation, and bone loss in mice.Am J Physiol Endocrinol Metab. 2005 Nov;289(5):E784-93. doi: 10.1152/ajpendo.00029.2005. Epub 2005 Jun 14. Am J Physiol Endocrinol Metab. 2005. PMID: 15956054
-
Osteoclast differentiation by RANKL and OPG signaling pathways.J Bone Miner Metab. 2021 Jan;39(1):19-26. doi: 10.1007/s00774-020-01162-6. Epub 2020 Oct 20. J Bone Miner Metab. 2021. PMID: 33079279 Review.
Cited by
-
Osteocyte-derived RANKL is a critical mediator of the increased bone resorption caused by dietary calcium deficiency.Bone. 2014 Sep;66:146-54. doi: 10.1016/j.bone.2014.06.006. Epub 2014 Jun 14. Bone. 2014. PMID: 24933342 Free PMC article.
-
Could use of Selective Serotonin Reuptake Inhibitors During Lactation Cause Persistent Effects on Maternal Bone?J Mammary Gland Biol Neoplasia. 2018 Jun;23(1-2):5-25. doi: 10.1007/s10911-018-9390-6. Epub 2018 Mar 30. J Mammary Gland Biol Neoplasia. 2018. PMID: 29603039 Review.
-
Unique Distal Enhancers Linked to the Mouse Tnfsf11 Gene Direct Tissue-Specific and Inflammation-Induced Expression of RANKL.Endocrinology. 2016 Feb;157(2):482-96. doi: 10.1210/en.2015-1788. Epub 2015 Dec 8. Endocrinology. 2016. PMID: 26646205 Free PMC article.
-
Osteocyte control of osteoclastogenesis.Bone. 2013 Jun;54(2):258-63. doi: 10.1016/j.bone.2012.08.121. Epub 2012 Aug 23. Bone. 2013. PMID: 22939943 Free PMC article. Review.
-
The osteoblast to osteocyte transition: epigenetic changes and response to the vitamin D3 hormone.Mol Endocrinol. 2014 Jul;28(7):1150-65. doi: 10.1210/me.2014-1091. Epub 2014 May 30. Mol Endocrinol. 2014. PMID: 24877565 Free PMC article.
References
-
- Parfitt AM. 1987. Bone and plasma calcium homeostasis. Bone 8(Suppl 1):S1–S8 - PubMed
-
- Kovacs CS. 2005. Calcium and bone metabolism during pregnancy and lactation. J Mammary Gland Biol Neoplasia 10:105–118 - PubMed
-
- Robling AG, Castillo AB, Turner CH. 2006. Biomechanical and molecular regulation of bone remodeling. Annu Rev Biomed Eng 8:455–498 - PubMed
-
- Schindeler A, McDonald MM, Bokko P, Little DG. 2008. Bone remodeling during fracture repair: the cellular picture. Semin Cell Dev Biol 19:459–466 - PubMed
-
- Teitelbaum SL, Ross FP. 2003. Genetic regulation of osteoclast development and function. Nat Rev Genet 4:638–649 - PubMed
Publication types
MeSH terms
Substances
Grants and funding
LinkOut - more resources
Full Text Sources
Molecular Biology Databases
Research Materials
