. 2012 Mar;112(6):1064-72.
doi: 10.1152/japplphysiol.01023.2011. Epub 2011 Dec 29.

Assessment of locomotion in chlorine exposed mice by computer vision and neural networks

Affiliations

Assessment of locomotion in chlorine exposed mice by computer vision and neural networks

Aristotelis S Filippidis et al. J Appl Physiol (1985). 2012 Mar.

Abstract

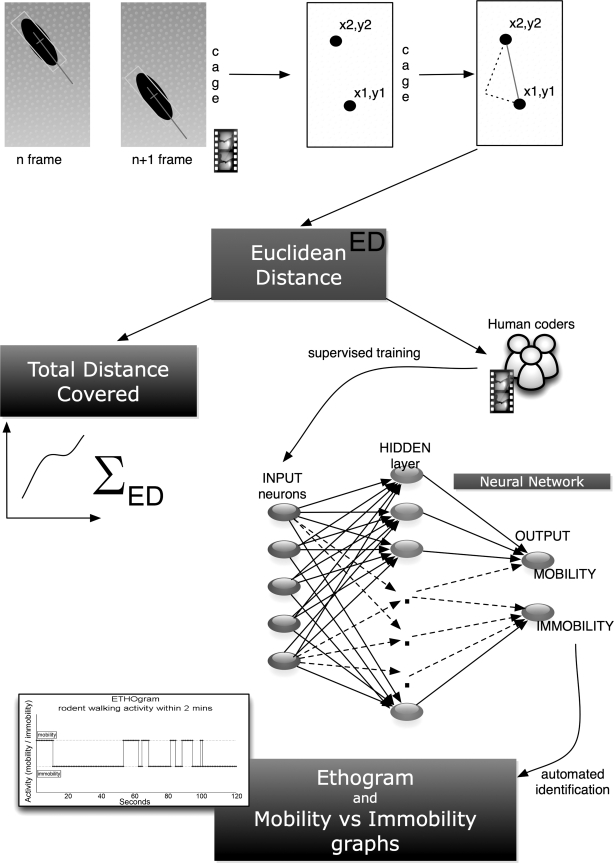
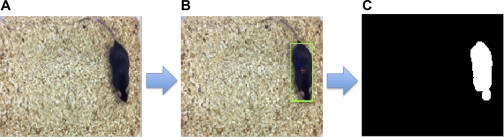
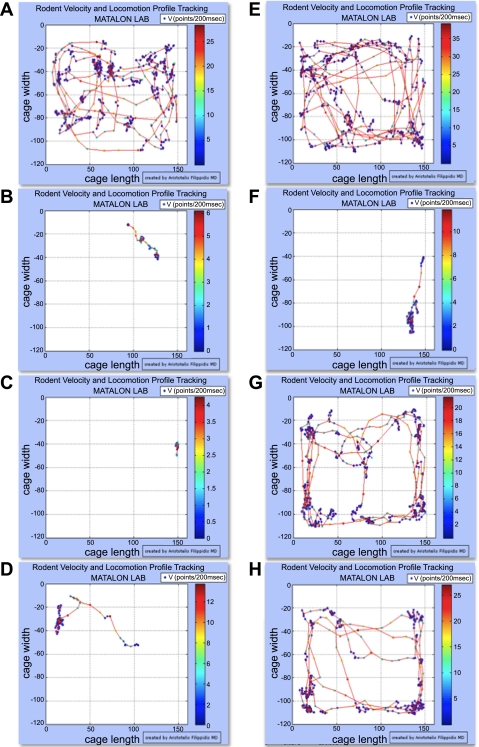
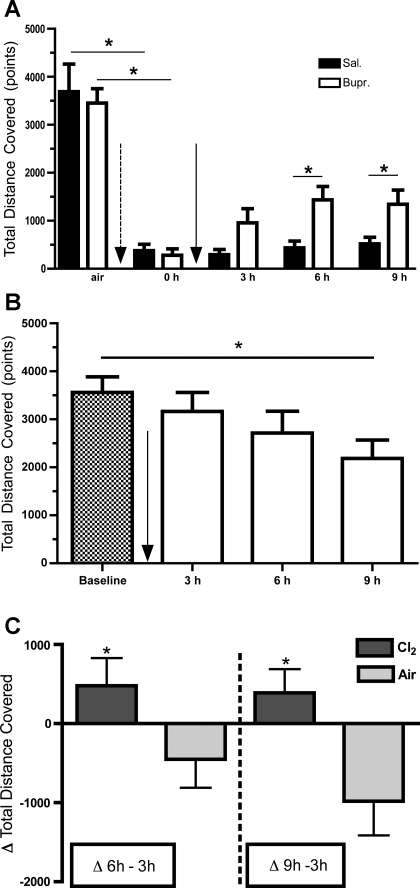
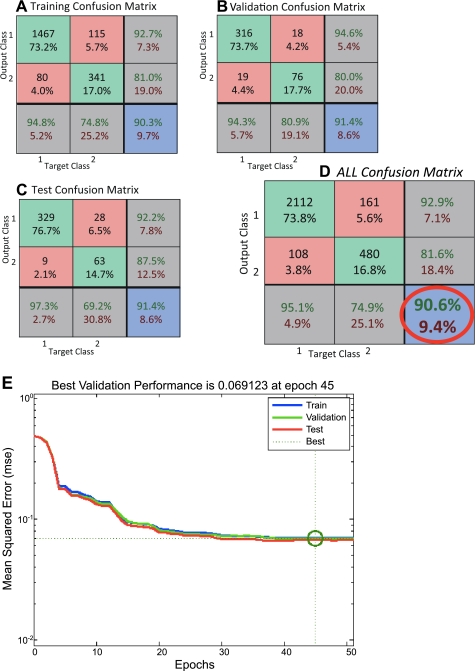
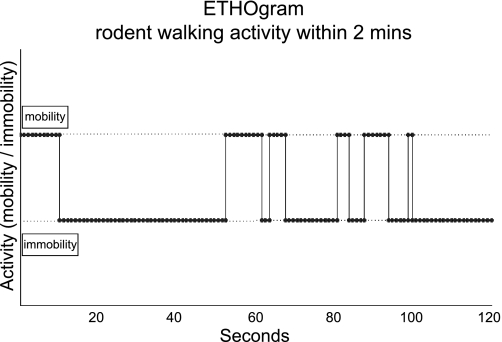
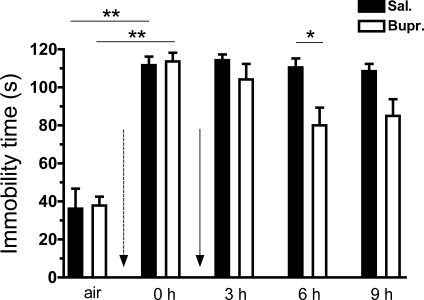
Assessment of locomotion following exposure of animals to noxious or painful stimuli can offer significant insights into underlying mechanisms of injury and the effectiveness of various treatments. We developed a novel method to track the movement of mice in two dimensions using computer vision and neural network algorithms. By using this system we demonstrated that mice exposed to chlorine (Cl(2)) gas developed impaired locomotion and increased immobility for up to 9 h postexposure. Postexposure administration of buprenorphine, a common analgesic agent, increased locomotion and decreased immobility times in Cl(2)- but not air-exposed mice, most likely by decreasing Cl(2)-induced pain. This method can be adapted to assess the effectiveness of various therapies following exposure to a variety of chemical and behavioral noxious stimuli.


Figures

Fig. 1.
Fig. 1.
Calculation of total distance covered (TDC), ethograms and mobility/immobility graphs. Figure demonstrates the calculation of Euclidian distance (ED) and how it is derived from the video session acquisition of the frames and the centroid of the mouse coordinates in the cage. In addition, the development of the neural network (NN) for automated detection of immobility events in the obtained video is described along with the creation of ethograms used in behavioral studies to plot the behavioral patterns of a test subject over time. In this case, we tracked mobility vs. immobility events.
Fig. 2.
Fig. 2.
Snapshots of the ARES software running under MATLAB. A: snapshot from original video showing the mouse in its cage. B: mouse with the surrounding green bounding box, the red cross representing the centroid used to record its position in the cage, and the blue line representing the instantaneous velocity at the starting point of the centroid. C: blob analysis after Otsu shape-based image thresholding and morphometric processing to extract the tail from the processed frames.
Fig. 3.
Fig. 3.
Traveled distances (track paths) and instantaneous velocities [V (points/200 ms)] of mice during 2-m intervals before and following exposure to Cl2. A: red lines, TDC covered within a 2-min period by a C57BL/6 mouse breathing air. Color dots represent instantaneous velocities during a 200-ms period according to the color scale on the right. The mouse was then exposed to Cl2 (400 ppm for 30 m) and returned to room air. B: ∼5 m post Cl2 exposure. After video tracking, the mouse received an intraperitoneal injection of saline (0.01 ml/g). C: 6 h post Cl2 exposure. D: 9 h post Cl2 exposure. E–H: same as in A–D but the mouse was injected with buprenorphine (0.05 mg/kg as described in materials and methods) immediately after F. Additional details are shown in materials and methods. Notice the much higher TDC post buprenorphine treatment.
Fig. 4.
Fig. 4.
A: TDC within a 2-m period before and following exposure to Cl2 and treatment with either buprenorphine or saline. Following return to room after exposure to Cl2 (400 ppm for 30 min; dotted arrow), mice were injected intraperitoneally with either buprenorphine (0.05 mg/kg) or saline (solid arrow). The y-axis shows the TDC [means ± SE (n = 6 mice per group)] for a 2-min period. This was done by measuring the ED of 2 centroids within 2 consecutive frames (200 ms apart) and then summing these distances in a 2-min period. 0 h refers to the first recording session, within 5 min postexposure. *P < 0.05 compared with the corresponding buprenorphine value of the same interval. One-sided Wilcoxon matched-pairs signed rank test was used for comparison of pretreatment groups. Repeated measures 2-way ANOVA was used for post-treatment groups followed by individual Bonferroni post hoc at individual sampling times. B: TDC within a 2-min period before (baseline) and following injection of buprenorphine in air breathing mice. Mice breathed air instead of Cl2. Solid arrow signifies the time of buprenorphine injection. The y-axis shows TDC (means ± SE; n = 6) in a 2-min period. One-way ANOVA followed by individual comparisons with Bonferroni post hoc t-tests. A significant reduction in TDC was identified only after 9 h postbuprenorphine injection compared with baseline values. *P < 0.05 compared with baseline. C: ΔTDC for Cl2 or air breathing mice treated with buprenorphine. The y-axis shows the difference in TDC at 6 or 9 h postbuprenorphine administration from the corresponding 3-h interval. Values are means ± SE; n = 6. *P < 0.05 compared with the corresponding value in the same time interval (1-sided, unpaired t-test). Dark bars, Cl2; shaded bars, air.
Fig. 5.
Fig. 5.
A–D: confusion matrices and performance plots obtained for the NN vs. the human coders. Overall performance and validation of the network can be identified within the red circle. NN was able to identify 90.6% of the events of immobility in agreement with the human coders. In each one of the confusion matrices, the top left green square corresponds to true positive (TP) incidents in absolute numbers and the percentage of TP incidents in total incidents used. Central green square corresponds to true negative (TN) incidents in absolute numbers and the percentage of TN incidents in total incidents used. Top red square corresponds to false positive (FP) incidents in absolute numbers and the percentage of FP incidents in total incidents used (describing statistical type 1 error). Middle left red square corresponds to false negative (FN) incidents in absolute numbers and the percentage of FN incidents in total incidents used (describing statistical type 2 error). Top right gray square with green letters describes the positive predictive value [TP/(TP+FP)]×100 and with the red letters the [FP/(TP+FP)]×100. Middle right gray square with green letters describes the negative predictive value [TN/(TN+FN)]×100 and with the red letters the [FN/(TN+FN)]×100. Bottom left gray square with green letters describes the sensitivity [TP/(TP+FN)]×100 and with the red letters the [FN/(TP+FN)]×100. Bottom middle gray square with green letters describes the specificity [TN/(TN+FP)]×100 and with the red letters the [FN/(TN+FP)]×100. Finally, the bottom right blue square with green letters describes the correctly classified incidents [(TP+TN)/total incidents used]×100, and with the red letters the incorrectly classified incidents [(FP+FN)/total incidents used]×100. Glossary of terms used: incidents were the signal data used as an input for the NN (immobility or mobility signals); total incidents were the total number of signals used for the construction of each confusion matrix; target class refers to the known immobility signals (target class 1) and the known mobility signals (target class 2) that the NN was supplied with; output class refers to the NN's classification response to the input data denoting as output class 1 the classification of immobile and as output class 2 the classification of mobile; TP were the incidents that were immobile and were classified as immobile; TN were the incidents that were mobile and were classified as mobile; FP were the incidents that were mobile and were classified as immobile; FN were the incidents that were immobile and were classified as mobile. E: performance plot of the NN. y-Axis demonstrates the mean squared error where the lower the error the better the performance. x-Axis demonstrates the epochs, which represent a step at the training of the NN. The best results were achieved at epoch 45 in our NN.
Fig. 6.
Fig. 6.
Example of an ethogram. Plot of an observed behavior where mobility and immobility events are tracked for a two min period. ARES can create such plots by using the NN structure to automatically label the mice behavior in a video track. Top line level is used for events (dots) of mobility whereas the bottom line level is used to plot events of immobility.
Fig. 7.
Fig. 7.
Immobility times calculated by the NN within a 2-min period before and following exposure to Cl2 and treatment with either buprenorphine or saline. We used the NN developed for the ARES software to identify immobility times in different groups. Following return to room after exposure to Cl2 (400 ppm for 30 min; dotted arrow), mice were injected intraperitoneally with either buprenorphine (0.05 mg/kg) or saline (solid arrow). y-Axis shows the immobility times in s [means ± SE (n = 6 mice per group)] for a 2-min period. Comparisons were done pre-exposure (air) vs. mice immediately postexposure to Cl2 (0 h, within 15 min). Dotted arrow signifies return to room after Cl2 exposure before the treatments with saline or buprenorphine. Solid arrow signifies the administration of treatments. Black bars refer to the saline injected mice and white bars to the buprenorphine-injected mice. **P < 0.01 (Mann-Whitney test, Kolmogorov-Smirnov test for normality). *P < 0.05 (2-way repeated-measures ANOVA to compare means for 3, 6, and 9 h postexposure followed by post hoc analysis with the t-test).
Fig. 8.
Fig. 8.
Peripheral oxygen saturations post Cl2 exposure. Mice were exposed either in Cl2 (400 ppm for 30 min; white bars) or air (solid bars). Oxygen saturations were measured noninvasively as mentioned in materials and methods at various times post Cl2 exposure. Values are means ± SE (n = 6 for each group). Comparisons were made based on Kolmogorov-Smirnov normality test results using either one-sided unpaired t-test (A and C) or one-sided Mann-Whitney exact test (B). *P = 0.0241.

Similar articles

Cited by

References

    1. Akay T, Fouad K, Pearson KG. New technique for drug application to the spinal cord of walking mice. J Neurosci Methods 171: 39–47, 2008 - PubMed
    1. Bessac BF, Jordt SE. Breathtaking TRP channels: TRPA1 and TRPV1 in airway chemosensation and reflex control. Physiology 23: 360–370, 2008 - PMC - PubMed
    1. Bessac BF, Sivula M, von Hehn CA, Caceres AI, Escalera J, Jordt SE. Transient receptor potential ankyrin 1 antagonists block the noxious effects of toxic industrial isocyanates and tear gases. FASEB J 23: 1102–1114, 2009 - PMC - PubMed
    1. Bessac BF, Sivula M, von Hehn CA, Escalera J, Cohn L, Jordt SE. TRPA1 is a major oxidant sensor in murine airway sensory neurons. J Clin Invest 118: 1899–1910, 2008 - PMC - PubMed
    1. Dell'Omo G, Vannoni E, Vyssotski AL, Di Bari MA, Nonno R, Agrimi U, Lipp HP. Early behavioural changes in mice infected with BSE and scrapie: automated home cage monitoring reveals prion strain differences. Eur J Neurosci 16: 735–742, 2002 - PubMed

Publication types

LinkOut - more resources