. 2012 Mar;32(3):712-20.
doi: 10.1161/ATVBAHA.111.227389. Epub 2011 Dec 29.

Acute exposure to low glucose rapidly induces endothelial dysfunction and mitochondrial oxidative stress: role for AMP kinase

Affiliations

Acute exposure to low glucose rapidly induces endothelial dysfunction and mitochondrial oxidative stress: role for AMP kinase

Jingli Wang et al. Arterioscler Thromb Vasc Biol. 2012 Mar.

Abstract

Objective: Hypoglycemia is associated with increased mortality. The reasons for this remain unclear, and the effects of low glucose exposure on vascular endothelial function remain largely unknown. We endeavored to determine the effects of low glucose on endothelial cells and intact human arterioles.

Methods and results: We exposed human umbilical vein endothelial cells to low glucose conditions in a clinically relevant range (40-70 mg/dL) and found rapid and marked reductions in nitric oxide (NO) bioavailability (P<0.001). This was associated with concomitantly increased mitochondrial superoxide production (P<0.001) and NO-dependent mitochondrial hyperpolarization (P<0.001). Reduced NO bioavailability was rapid and attributable to reduced endothelial nitric oxide synthase activity and destruction of NO. Low glucose rapidly activated AMP kinase, but physiological activation failed to restore NO bioavailability. Pharmacological AMP kinase activation led to phosphorylation of endothelial nitric oxide synthase's Ser633 activation site, reversing the adverse effects of low glucose. This protective effect was prevented by L-NG-Nitroarginine methyl ester. Intact human arterioles exposed to low glucose demonstrated marked endothelial dysfunction, which was prevented by either metformin or TEMPOL.

Conclusion: Our data suggest that moderate low glucose exposure rapidly impairs NO bioavailability and endothelial function in the human endothelium and that pharmacological AMP kinase activation inhibit this effect in an NO-dependent manner.


Figures

Figure 1
Figure 1. Effect of Low Glucose Exposure on HUVEC NO and mitochondrial superoxide production
(a) Impairment of VEGF-stimulated NO production relative to basal NO production appears to begin at 80 mg/dL(n = 8, p<0.001 overall), with significant decreases in stimulated NO production at concentrations ≤ 70 mg/dL(*p<0.001 vs. 90 mg/dL). (b) Net NO production following VEGF stimulation is significantly suppressed at 5, 30, and 60 minutes following exposure to LG (n=6, P<0.001 overall, *-P<0.05 at all time points relative NG). (c) Mitochondrial superoxide production as a percentage of control glucose concentration (90 mg/dL) is significantly increased at glucose concentrations of ≤ 80 mg/dL (P<0.001 overall, n = 8, *p<0.05 vs. 90 mg/dL at all time points). (d) MitoSox™ signal under LG conditions is completed eliminated in the presence of either PEG-SOD or PEG-Catalase (n=8, P<0.001 overall, P < 0.05 for LG vs all other conditions). (e) LG induced a significant increase in cellular hydrogen peroxide levels as measured by DCF fluorescence intensity. This increase was completely suppressed by mitochondrial targeted anti-oxidant therapy with mito-TEMPOL (1mM) (*-P=0.01 overall, P< 0.05 for LG versus all other exposure states (f) 30 minutes of low glucose exposure significantly inhibitor NO production as measured by the conversion of L-arginine to L-citruilline (n=12, 731±273 vs. 206±62 fmol citrulline/mg protein/min, p=0.026). (g) The addition of BH4 (100 µM) had no effect on LG-induced inhibition of stimulated NO production. TEMPOL (1 mM) significantly reversed LG-induced inhibition of stimulated NO production with or with the concomitant presence of BH4(n=5–9, P<0.001 overall, P<0.02 for LG vs. all other conditions except LG+BH4)
Figure 2
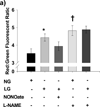
Figure 2. Role of NO in LG-induced Mitochondrial Hyperpolarization and Mitochondrial ROS production
(a) LG induced significant mitochondrial membrane hyperpolarization as reflected by an increased red: green fluorescent intensity ratio from JC-1 relative to NG. Further, exposure to exogenous NO (Spermine NONOate, 10 µM) reversed LG-induced hyperpolarization, while inhibition of eNOS with L-NAME (1 mM) induced hyperpolarization under NG conditions. (N=6–22 for each exposure. *P<0.001 overall and vs. NG, P=0.007 vs. LG+NONOate. P=0.004 for NG vs. NG+LNAME). (b) L-NAME increases mitochondrial ROS production under NG (90 mg/dL D-glucose) to the level seen under LG conditions (40 mg/dL D-glucose + 50 mg/dL L-glucose). Spermine NONOate exposure prevented LG induced increases in mitochondrial ROS production. No increased in mitochondrial ROS production was seen with the addition of L-NAME under LG conditions (P<0.001 overall, *-P <0.005 for NG+L-NAME vs. NG and LG+NONOate, †- P<0.008 for LG vs. NG, NG+NONOate, and LG+NONOate).
Figure 3
Figure 3. a–h: Effect of Low Glucose Exposure on AMP Kinase Phosphorylation
(a) Raw results from Western blot for tAMPK and pAMPK (b) Exposure of HUVECs to LG for 15–30 minutes resulted in an increase in pAMPK/tAMPK levels. While the ratio remained modestly elevated compared to baseline, pAMPK/tAMPK dropped significantly by 45–60 minutes into LG and remained at this level at the 2 hour time point (n=3–5, P<0.001 overall, *-P<0.05 versus time 0, †-P<0.05 versus 45–60 minute and 2 hour time points). (c) Sample raw Western blot result for peNOS1177 and total eNOS (d) peNOS/eNOS ratio was significantly reduced within 5 minutes of LG exposure (N=8, P=0.02overall, *-P=0.03 for 5, 45–60, and 120 minute durations of LG exposure vs.0 minutes). (e) Representative Western Blot result for Figure 3f (f) 1 hour of metformin (10 µM) has no effect on LG induced loss of eNOS phosphorylation at the Ser1177 activation site (n=7, P=0.01 overall, *-P<0.05 vs. NG). (g) Representative Western Blot for Figure 3h. (h) 1 hour of metformin (10 µM) significantly increases eNOS phosphorylation at the Ser633 activation site under both NG and LG conditions. LG alone does not significantly alter eNOS phosphorylation at the Ser633 site (N=10, P<0.001 overall, *-P<0.001 for both LG and NG with metformin vs. NG, †-*P<0.001 LG vs. LG + metformin).
Figure 4
Figure 4. a–b: Effect of Pharmacological AMPK activation on Mitochondrial ROS Production and NO bioavailability
(a) Both metformin (10 µM) and AICAR (100 µM) significantly suppressed LG-induced increases in mitochondrial ROS production (n = 3–6, P< 0.001 overall, *-P<0.05 vs. LG,) and (b) reversed LG-inducted inhibition of NO production. (n = 5, P< 0.001 overall *-P<0.05 vs. all other exposure groups except NG). (c) Neither metformin (MET) nor AICAR altered mitochondrial ROS production under NG conditions (n=6, P=0.07). (d) Neither metformin (MET) nor AICAR altered NO production under NG conditions (n=6, P=0.46).
Figure 5
Figure 5. Low Glucose Induced Endothelial Dysfunction is Prevented by Treatment with Metformin
(a) Percent vasodilation from baseline was measured following short-term of exposure to four conditions: NG (n=13) or LG (n=6) with or without concomitant exposure to metformin (10 µM, n=3) or PEG-SOD (150 U/mL, n=3). Overall, low glucose exposure significantly impaired endothelial function relative to all 3 other exposure states (P<0.001 for all comparisons). *-P<0.05 vs. normal glucose, low glucose+metformin, and low glucose + PEG-SOD at the indicated concentration of acetylcholine. (b) LG did not alter endothelium-independent responses to exogenous NO (NONOate, n=3, P= Ach- acetylcholine. P=0.20 for interaction between dose and exposure condition).
Figure 6
Figure 6. LG-Induced Endothelial Dysfunction: Role of Mitochondrial Superoxide Production and Prevention by AMPK Activation
Acute LG exposure leads to rapid inhibition of eNOS and a reduction in bioavailable NO. This leads to a subsequent increase in mitochondrial ETC activity, mitochondrial membrane hyperpolarization, and increased mitochondrial superoxide production. Increased mitochondrial superoxide production can further reduce NO bioavailability and leads to increased cellular hydrogen peroxide levels that activate AMPK isoform α1 through a CaMKKβ dependent pathway. LG induced losses of NO bioavailability can be prevented/reversed by treatment with AMPKα2 activating agents acting through an LKB1 dependent activation pathway.

Similar articles

Cited by

References

    1. Patel A, MacMahon S, Chalmers J, Neal B, Billot L, Woodward M, Marre M, Cooper M, Glasziou P, Grobbee D, Hamet P, Harrap S, Heller S, Liu L, Mancia G, Mogensen CE, Pan C, Poulter N, Rodgers A, Williams B, Bompoint S, de Galan BE, Joshi R, Travert F. Intensive blood glucose control and vascular outcomes in patients with type 2 diabetes. N Engl J Med. 2008;358:2560–2572. - PubMed
    1. Gerstein HC, Miller ME, Byington RP, Goff DC, Jr, Bigger JT, Buse JB, Cushman WC, Genuth S, Ismail-Beigi F, Grimm RH, Jr, Probstfield JL, Simons-Morton DG, Friedewald WT. Effects of intensive glucose lowering in type 2 diabetes. N Engl J Med. 2008;358:2545–2559. - PMC - PubMed
    1. Zoungas S, Patel A, Chalmers J, de Galan BE, Li Q, Billot L, Woodward M, Ninomiya T, Neal B, MacMahon S, Grobbee DE, Kengne AP, Marre M, Heller S. Severe hypoglycemia and risks of vascular events and death. N Engl J Med. 2010;363:1410–1418. - PubMed
    1. Finfer S, Chittock DR, Su SY, Blair D, Foster D, Dhingra V, Bellomo R, Cook D, Dodek P, Henderson WR, Hebert PC, Heritier S, Heyland DK, McArthur C, McDonald E, Mitchell I, Myburgh JA, Norton R, Potter J, Robinson BG, Ronco JJ. Intensive versus conventional glucose control in critically ill patients. N Engl J Med. 2009;360:1283–1297. - PubMed
    1. Kosiborod M, Inzucchi SE, Krumholz HM, Xiao L, Jones PG, Fiske S, Masoudi FA, Marso SP, Spertus JA. Glucometrics in patients hospitalized with acute myocardial infarction: defining the optimal outcomes-based measure of risk. Circulation. 2008;117:1018–1027. - PubMed

Publication types

MeSH terms