. 2012 Feb 24;287(9):6196-207.
doi: 10.1074/jbc.M111.243923. Epub 2011 Dec 29.

Regulation of the ATP-sensitive potassium channel subunit, Kir6.2, by a Ca2+-dependent protein kinase C

Affiliations

Regulation of the ATP-sensitive potassium channel subunit, Kir6.2, by a Ca2+-dependent protein kinase C

Qadeer Aziz et al. J Biol Chem. .

Abstract

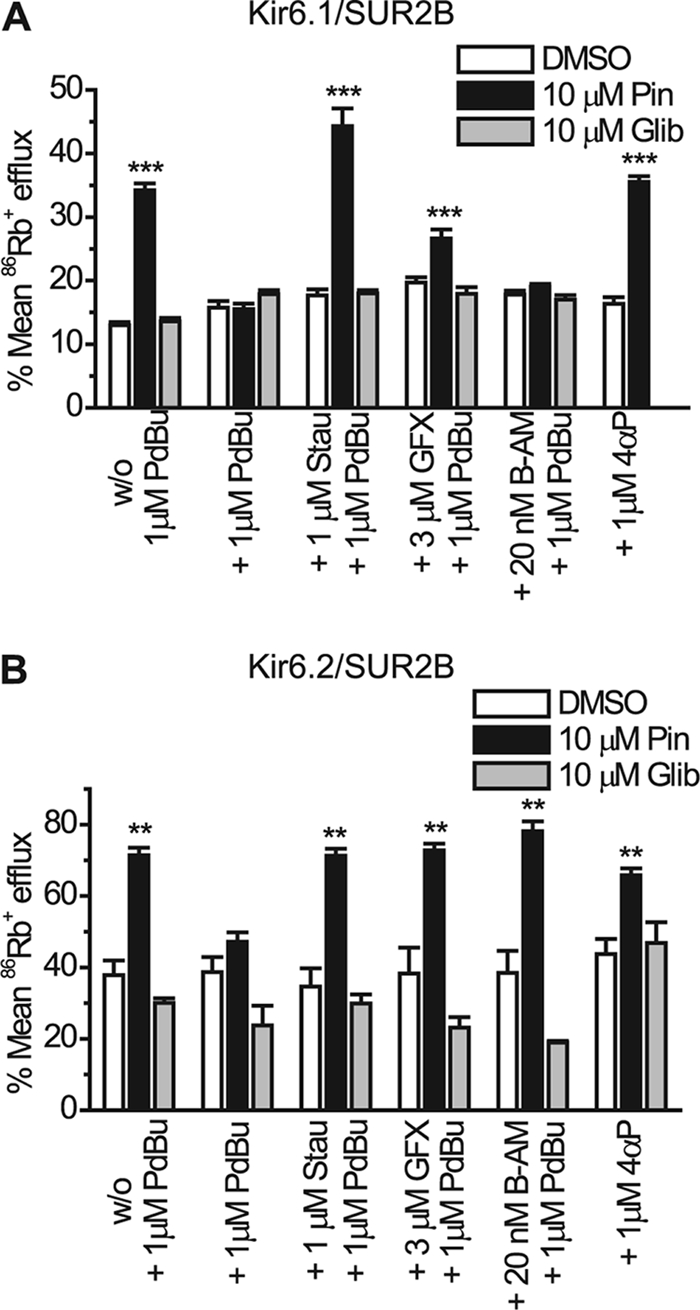
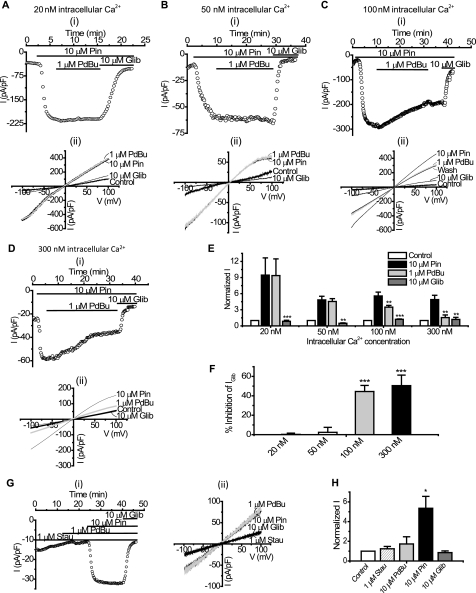
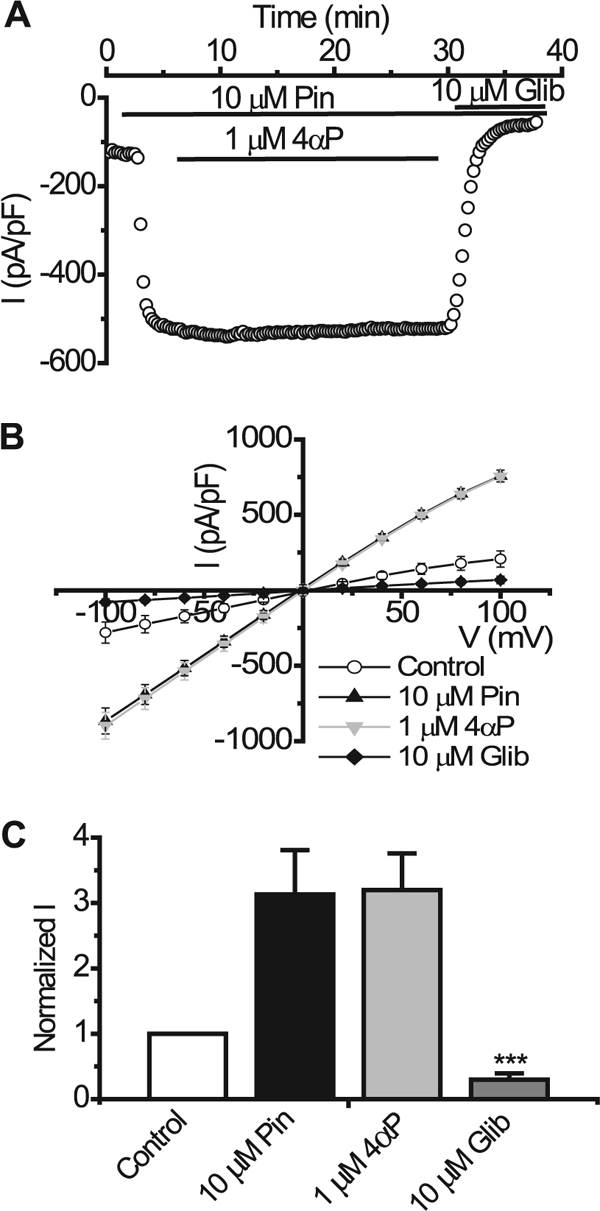
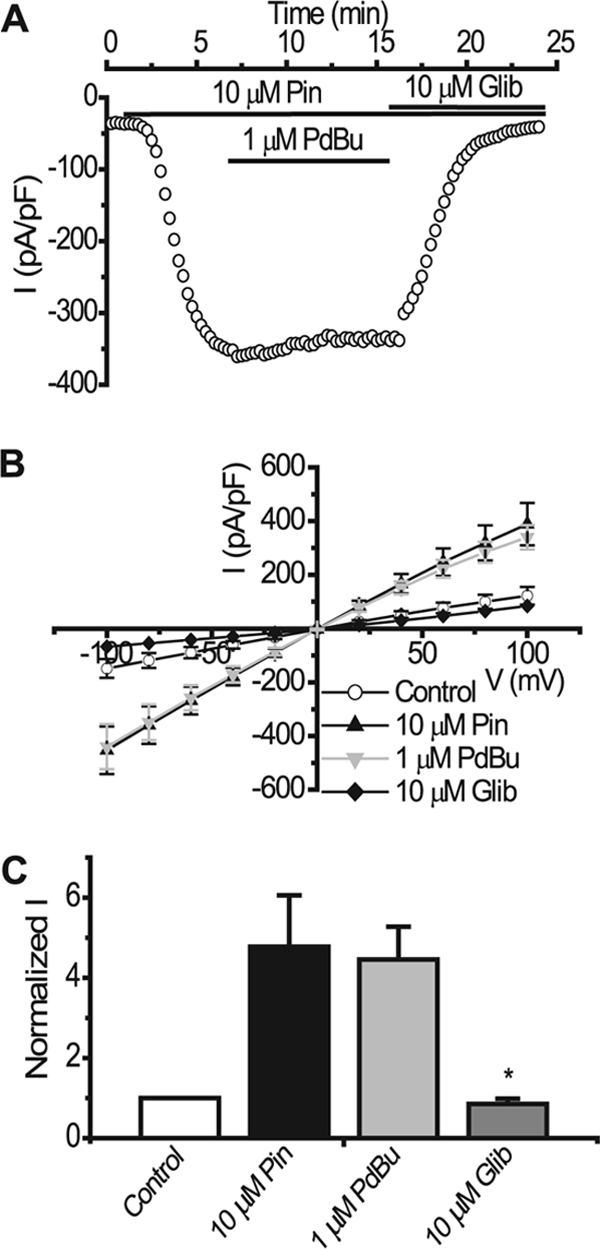
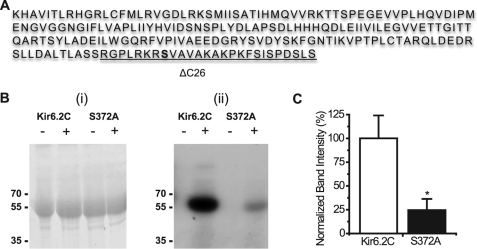
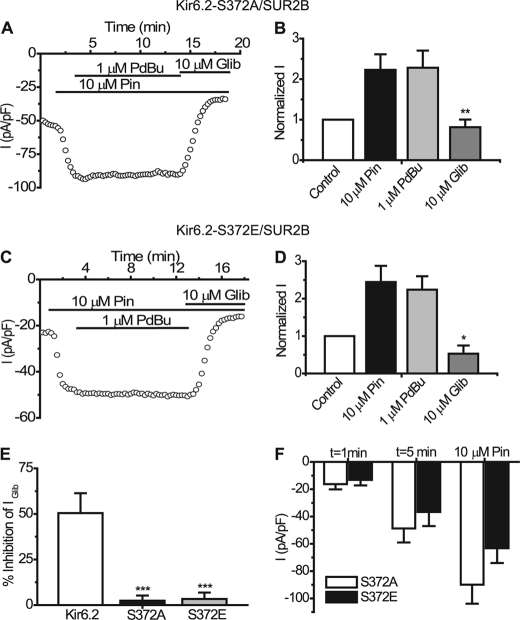
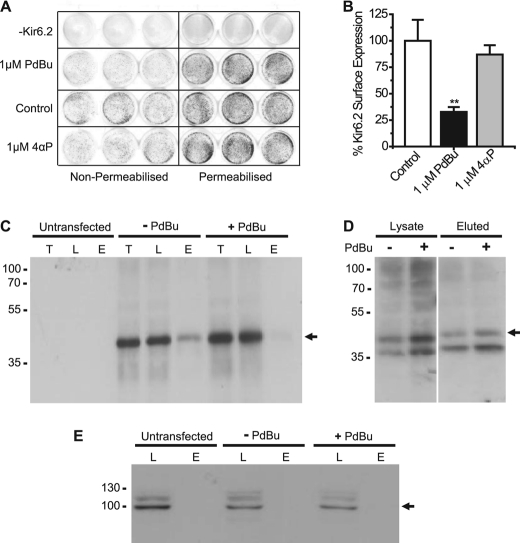
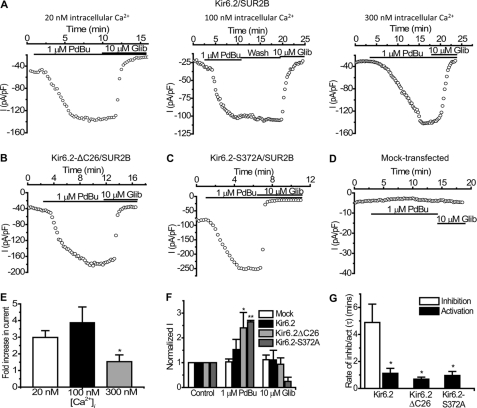
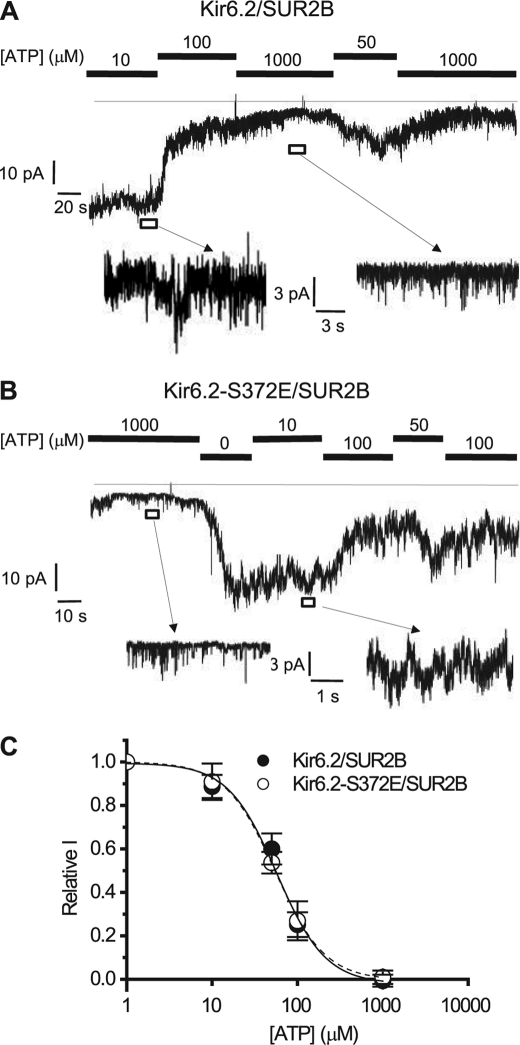
The activity of ATP-sensitive potassium (K(ATP)) channels is governed by the concentration of intracellular ATP and ADP and is thus responsive to the metabolic status of the cell. Phosphorylation of K(ATP) channels by protein kinase A (PKA) or protein kinase C (PKC) results in the modulation of channel activity and is particularly important in regulating smooth muscle tone. At the molecular level the smooth muscle channel is composed of a sulfonylurea subunit (SUR2B) and a pore-forming subunit Kir6.1 and/or Kir6.2. Previously, Kir6.1/SUR2B channels have been shown to be inhibited by PKC, and Kir6.2/SUR2B channels have been shown to be activated or have no response to PKC. In this study we have examined the modulation of channel complexes formed of the inward rectifier subunit, Kir6.2, and the sulfonylurea subunit, SUR2B. Using a combination of biochemical and electrophysiological techniques we show that this complex can be inhibited by protein kinase C in a Ca(2+)-dependent manner and that this inhibition is likely to be as a result of internalization. We identify a residue in the distal C terminus of Kir6.2 (Ser-372) whose phosphorylation leads to down-regulation of the channel complex. This inhibitory effect is distinct from activation which is seen with low levels of channel activity.


Figures

FIGURE 1.
FIGURE 1.
PKC-mediated inhibition of 86Rb+ efflux through Kir6.2/SUR2B is Ca2+-dependent. Mean 86Rb+ efflux data from HEK293 cells stably transfected with Kir6.1/SUR2B (A) or Kir6.2/SUR2B (B) are shown. Transfected cells were preincubated with HEPES-buffered saline ± PKC inhibitors, 1 μm staurosporine (stau), or 3 μm GF109203X (GFX), or the calcium chelator, 20 nm BAPTA-AM (B-AM) for 15 min prior to a 5-min incubation with 1 μm PdBu or 4α-phorbol (4αP) at 37 °C before channel activators/inhibitors were added as follows (DMSO, 10 μm pinacidil, 10 μm pinacidil + 10 μm glibenclamide). Mean 86Rb+ flux was calculated as percentage efflux of initial 86Rb+ content. Data are shown as mean ± S.E. (error bars), n = 9. **, p < 0.01; ***, p < 0.001 when compared with PdBu.
FIGURE 2.
FIGURE 2.
PKC activation by PdBu is Ca2+-dependent and inhibits whole cell Kir6.2/SUR2B currents. Whole cell currents recorded from HEK293 cells stably transfected with Kir6.2/SUR2B are shown. For time course experiments, currents were evoked using a series of ramps (1 s every 15 s from −100 mV to +100 mV), and drugs were superfused as indicated by the solid bars. Current-voltage (I-V) relationships were constructed by a series of voltage steps (20-mV increments) from −100 mV to +100 mV from a holding potential of 0 mV. Representative time course data (i) (at −50 mV) and (ii) I-V relationship show the effects of 1 μm PdBu on KATP currents recorded in 20 nm (A), 50 nm (B), 100 nm (C), and 300 nm (D) free intracellular Ca2+ in the pipette. E, mean whole cell patch data were taken at −50 mV in 20 (n = 5), 50 (n = 6), 100 (n = 5), and 300 (n = 8) nm free intracellular Ca2+ and normalized to the control (mean ± S.E. (error bars), **, p < 0.01; ***, p < 0.001 compared with pinacidil). F, PdBu-induced inhibition of Kir6.2/SUR2B currents in 20, 50, 100, and 300 nm free intracellular Ca2+ (mean ± S.E., ***, p < 0.001) was compared. G, representative time course experiment (i) and I-V relationship (ii) in the presence of 1 μm staurosporine (stau) with 300 nm free intracellular Ca2+ in the pipette is shown. H, mean whole cell data in the presence of staurosporine at −50 mV with 300 nm free intracellular Ca2+ were normalized to the control (mean ± S.E., n = 8, *, p < 0.05 compared with control).
FIGURE 3.
FIGURE 3.
Inactive phorbol ester, 4α-phorbol, does not inhibit pinacidil-evoked currents through Kir6.2/SUR2B channels. A, whole cell recording from HEK293 cell stably transfected with Kir6.2/SUR2B. Currents were evoked using a series of 1-s voltage ramps from −100 mV to +100 mV from a holding potential of 0 mV every 15 s in 300 nm free intracellular Ca2+. KATP current was activated by superfusing the patch with 10 μm pinacidil (Pin), 1 μm 4α-phorbol (4αP), and 10 μm glibenclamide (Glib) were superfused in the presence of pinacidil as indicated by the solid bars. B, mean I-V relationship. Currents were elicited by a series of voltage steps from −100 to +100 mV in 20-mV increments. C, normalized mean currents at −50 mV in the presence and absence (Control) of 1 μm 4α-phorbol (mean ± S.E. (error bars), n = 4, ***, p < 0.001 compared with pinacidil).
FIGURE 4.
FIGURE 4.
PdBu does not inhibit pinacidil-activated Kir6.2ΔC26/SUR2B currents. A, representative time course trace showing no PdBu effect on pinacidil-activated current in HEK293 cells expressing Kir6.2ΔC26/SUR2B at −50 mV. Drugs were applied as indicated by the solid bars. B, mean I-V relationship. Currents were elicited by a series of voltage steps from −100 to +100 mV in 20-mV increments. C, normalized mean data from experiments like the one in A (mean ± S.E. (error bars), n = 10, *, p < 0.05 compared with pinacidil).
FIGURE 5.
FIGURE 5.
Ser-372 is phosphorylated in vitro by PKC. A, amino acid sequence of the C terminus (185–390) of the mouse Kir6.2 subunit. Fusion of this sequence to MBP and subsequent phosphopeptide mapping showed that the Ser-372 (highlighted) residue is modified by a phosphorylation group. The residues removed by the ΔC26 truncation are underlined. Bi, Coomassie-stained 10% SDS-PAGE of MBP-Kir6.2C and the MBP-Kir6.2C S372A mutant in the presence (+) or absence (−) of PKC. Bii, corresponding autoradiograph after 65 h. Marker sizes in kDa are as indicated in the figures. C, graph showing difference in the band intensities between the MBP-Kir6.2C and the MBP-Kir6.2C-S372A mutant in the presence of PKC. Error bars, S.E.; n = 4, *, p < 0.05.
FIGURE 6.
FIGURE 6.
Kir6.2-S372A/SUR2B and Kir6. 2-S372E/SUR2B currents are not inhibited by PdBu. A, representative time course trace recorded from a HEK293 cell expressing Kir6.2-S372A/SUR2B. Currents were evoked using a series of repetitive voltage steps from −100 to +100 mV. Drugs were superfused where indicated by the solid bars. B, summary of the mean currents recorded at −50 mV from cells expressing Kir6.2-S372A/SUR2B in the presence of the indicated drugs (mean ± S.E. (error bars), n = 10, **, p < 0.01 compared with pinacidil). C, typical time course trace from a cell expressing Kir6.2-S372E/SUR2B. D, normalized mean currents from Kir6.2-S372E/SUR2B channels in the presence of the indicated drugs (mean ± S.E., n = 8, *, p < 0.05). E, comparison of the percentage inhibition in the presence of 1 μm PdBu of Kir6.2/SUR2B (n = 4), Kir6.2-S372A/SUR2B (n = 10) and Kir6.2-S372E/SUR2B (n = 8), respectively (***, p < 0.001). F, summary of the mean current density of Kir6.2-S372A/SUR2B and Kir6.2-S372E/SUR2B at two time points and in the presence of 10 μm pinacidil.
FIGURE 7.
FIGURE 7.
PdBu reduces surface expression of Kir6.2. A, representative 24-well plate showing visualization of cell surface expression using the In Cell Western Assay. The left side of the plate shows the surface labeling of nonpermeabilized cells, and the right side indicates labeling of the total protein in the Triton X-100-permeabilized cells. B, bar chart showing the percentage of Kir6.2 surface expression in the presence of 1 μm PdBu or 1 μm 4α-phorbol (4αP). Error bars, S.E. **, p < 0.01 compared with control. C, Western blot using the anti-HA antibody to show the changes in Kir6.2-HA at the surface of CHO-K1 cells in the presence or absence of PdBu. T, total protein; L, cell lysate; E, protein eluted from avidin. D, Western blot using the anti-HA antibody to determine surface expression of Kir6.2 S372A in the absence (−) and presence (+) of PdBu. E, Western blot using anti-calnexin antibody to detect the intracellular control protein calnexin. Marker sizes are shown in kDa.
FIGURE 8.
FIGURE 8.
PdBu activates basal Kir6.2 currents. A–D, representative whole cell recordings showing the effect of PdBu on Kir6.2/SUR2B (A), Kir6.2ΔC26/SUR2B (B), Kir6.2-S372A/SUR2B (C), and mock-transfected cells and their basal currents (D). Currents were evoked using a series of 1-s voltage ramps from −100 mV to +100 mV from a holding potential of 0 mV. Recordings were carried out using 300 nm free intracellular Ca2+ unless indicated otherwise. E, mean data showing PdBu-induced activation of basal Kir6.2/SUR2B current in 20, 100, and 300 nm free intracellular Ca2+ concentrations (mean ± S.E. (error bars), n = 6, 4, and 6 cells respectively, *, p < 0.05). F, normalized mean data comparing the effect of PdBu on Kir6.2/SUR2B, Kir6.2ΔC26/SUR2B, Kir6.2-S372A/SUR2B and mock-transfected HEK293 cell basal current at −50 mV (mean ± S.E., n = 6, 5, 4, and 4 cells, respectively). G, comparison of the rate of PdBu-induced inhibition of Kir6.2/SUR2B current with the rates of PdBu-induced increase of Kir6.2/SUR2B, Kir6.2ΔC26/SUR2B, and Kir6.2-S372A/SUR2B basal current (mean ± S.E., n = 6, 5, and 4, respectively, *, p < 0.05).
FIGURE 9.
FIGURE 9.
Phosphomimetic mutation S372E does not alter the ATP sensitivity of the Kir6.2/SUR2B channel. A and B, representative currents from inside-out patches containing Kir6.2/SUR2B (A) and Kir6.2-S372E/SUR2B (B) channels. The excised patches were held at −50 mV in symmetrical 140 mm K+ solution and subsequently exposed to different intracellular concentrations of ATP. C, relative ATP sensitivity of Kir6.2/SUR2B and Kir6.2-S372E/SUR2B. Data were grouped from four to eight inside-out patches and fitted to the following equation: Relative current = 1/(1 + ([ATP]/IC50)k) where relative current is the current relative to the current measured in the absence of ATP and k is the Hill coefficient.

Similar articles

Cited by

References

    1. Rodrigo G. C., Standen N. B. (2005) ATP-sensitive potassium channels. Curr. Pharm. Des. 11, 1915–1940 - PubMed
    1. Yellon D. M., Downey J. M. (2003) Preconditioning the myocardium: from cellular physiology to clinical cardiology. Physiol. Rev. 83, 1113–1151 - PubMed
    1. Babenko A. P., Aguilar-Bryan L., Bryan J. (1998) A view of SUR/Kir6.x, KATP channels. Annu. Rev. Physiol. 60, 667–687 - PubMed
    1. Seino S. (1999) ATP-sensitive potassium channels: a model of heteromultimeric potassium channel/receptor assemblies. Annu. Rev. Physiol. 61, 337–362 - PubMed
    1. Tucker S. J., Gribble F. M., Proks P., Trapp S., Ryder T. J., Haug T., Reimann F., Ashcroft F. M. (1998) Molecular determinants of KATP channel inhibition by ATP. EMBO J. 17, 3290–3296 - PMC - PubMed

Publication types

MeSH terms

LinkOut - more resources