

doi: 10.3389/fncel.2011.00029.
eCollection 2011.
Environmental enrichment decreases GABAergic inhibition and improves cognitive abilities, synaptic plasticity, and visual functions in a mouse model of Down syndrome
Affiliations
- PMID: 22207837
- PMCID: PMC3245647
- DOI: 10.3389/fncel.2011.00029
Item in Clipboard
Environmental enrichment decreases GABAergic inhibition and improves cognitive abilities, synaptic plasticity, and visual functions in a mouse model of Down syndrome
Front Cell Neurosci.
.
Abstract
Down syndrome (DS) is the most common genetic disorder associated with mental retardation. It has been repeatedly shown that Ts65Dn mice, the prime animal model for DS, have severe cognitive and neural plasticity defects due to excessive inhibition. We report that increasing sensory-motor stimulation in adulthood through environmental enrichment (EE) reduces brain inhibition levels and promotes recovery of spatial memory abilities, hippocampal synaptic plasticity, and visual functions in adult Ts65Dn mice.
Keywords: Down syndrome; GABAergic inhibition; Ts65Dn mice; cerebral plasticity; environmental enrichment.
Figures
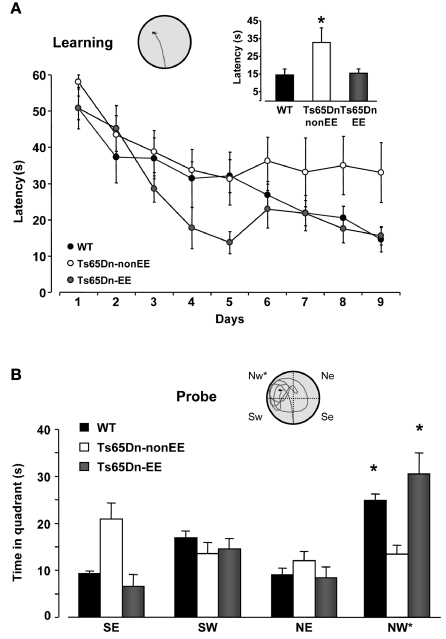
Environmental enrichment promotes spatial learning in Ts65Dn mice. (A) Learning curves for WT (black) and Ts65Dn mice maintained in standard (Ts65Dn-non-EE, white) or enriched (Ts65Dn-EE, gray) environmental conditions. The histogram shows latency to locate the submerged platform on the last day of training for the three groups. One-Way ANOVA followed by a multiple comparison procedure (Holm–Sidak method) showed a statistical difference between WT and Ts65Dn-non-EE mice, but not between WT and Ts65Dn-EE mice (p = 0.885). Inset is an example of swimming path during the last day of training for a Ts65Dn-EE mouse. (B)Probe trial. Two-Way RM ANOVA revealed a statically significant interaction between the genotype group and the pool quadrant (p < 0.001). A Holm–Sidak multiple comparison procedure revealed that while Ts65Dn-non-EE did not show any preference for the target (NW) quadrant, both WT and Ts65Dn-EE mice spent significantly more time in the NW quadrant than in the other quadrants. Moreover, the time spent in the target quadrant was shorter in Ts65Dn-non-EE mice than in the other two groups, which instead did not differ between each other (p = 0.1). Inset shows an example of swimming path during the probe session for a Ts65Dn-EE mouse. * statistical significance. Error bars, s.e.m.
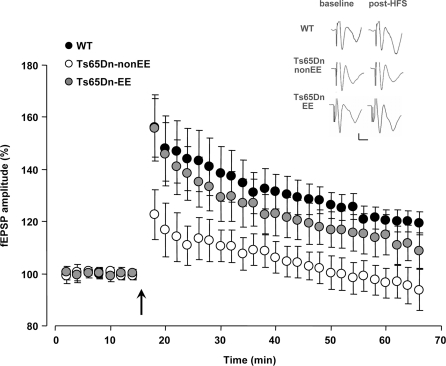
Recovery of long-term potentiation (LTP) at medial perforant path–granule cell synapses in Ts65Dn mice reared in environmental enrichment. Averaged data for LTP induced in WT (black circles), Ts65Dn-non-EE (white circles) and Ts65Dn-EE mice (gray circles). Only slices from WT and Ts65Dn-EE mice showed potentiation of the response after high frequency stimulation (HFS) (Two-Way RM ANOVA, baseline vs. the last 20 min post-HFS, p < 0.001), while slices from Ts65Dn-non-EE did not show potentiation (Two-Way RM ANOVA, baseline vs. the last 20 min post-HFS, p = 1). A multiple comparison procedure (Holm–Sidak method) showed a statistical difference in LTP levels between WT and Ts65Dn-non-EE mice, between Ts65Dn-non-EE mice and Ts65Dn-EE mice and between WT and Ts65Dn-EE mice (p < 0.001). Sample traces (vertical scale bar: 200 μV; horizontal scale bar: 2 ms) from the three experimental groups before (baseline) and after HFS (post-HFS) are also reported. The arrow indicates HFS. * statistical significance; error bars, s.e.m.
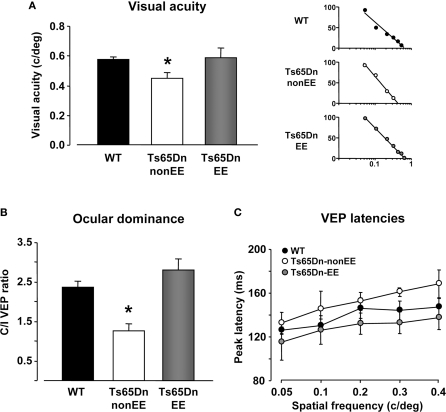
Restoration of visual functions in Ts65Dn mice by environmental enrichment. Visual acuity (A), ocular dominance (B)and peak latency (C)assessed by electrophysiological recordings of visual evoked potentials (VEPs) from the primary visual cortex in WT (black), Ts65Dn-non-EE, (white), and Ts65Dn-EE (gray) mice. One-Way ANOVA showed that a statistical difference in the mean values was present among the three groups for both visual acuity and C/I VEP ratio (p < 0.05 and p < 0.001, respectively); a multiple comparison procedure (Holm–Sidak method) showed a statistical difference between WT and Ts65Dn-non-EE mice and between Ts65Dn-non-EE mice and Ts65Dn-EE mice, but not between WT and Ts65Dn-EE mice (p = 0.82 for visual acuity; p = 0.14 for C/I VEP ratio). VEP latencies of Ts65Dn-EE mice were statistically different from Ts65Dn-non-EE animals, but not from WT mice (Two-Way RM ANOVA). Representative examples of electrophysiological visual acuity assessment of the three experimental groups are also reported on the right of the (a) panel. Visual acuity was obtained by extrapolation to zero amplitude of the linear regression through the data points in a curve where VEP amplitude is plotted against log spatial frequency. * statistical significance; error bars, s.e.m.
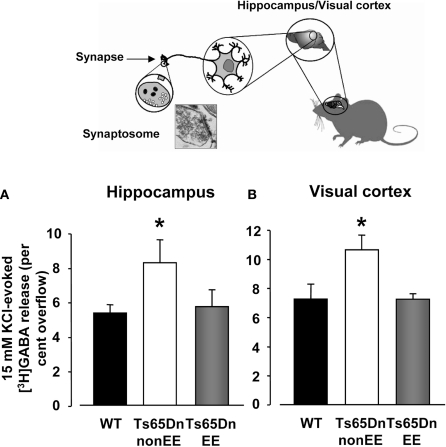
Depolarization-evoked release of GABA from synaptosomes. Insert depicts the synaptosome technique. 15 mM KCl evoked GABA release from hippocampal (A)and visual cortex (B)synaptosomes of wild-type (WT, black), Ts65Dn-non-EE (white) and Ts65Dn-EE (gray) mice. Two-Way ANOVA showed a significant difference among the different levels of group (p = 0.001); a multiple comparison procedure (Holm–Sidak method) showed that levels of GABA were significantly higher, for both the hippocampus and the visual cortex, in Ts65Dn non-enriched mice compared to WT animals, while no statistical difference was present between Ts65Dn enriched animals and WT mice (p = 0.79 for the hippocampus, p = 0.98 for the visual cortex). * statistical significance; error bars, s.e.m.
Similar articles
-
Fluoxetine in adulthood normalizes GABA release and rescues hippocampal synaptic plasticity and spatial memory in a mouse model of Down syndrome.Neurobiol Dis. 2014 Mar;63:12-9. doi: 10.1016/j.nbd.2013.11.010. Epub 2013 Nov 19. Neurobiol Dis. 2014. PMID: 24269730
-
Early environmental therapy rescues brain development in a mouse model of Down syndrome.Neurobiol Dis. 2015 Oct;82:409-419. doi: 10.1016/j.nbd.2015.07.014. Epub 2015 Aug 2. Neurobiol Dis. 2015. PMID: 26244989
-
Neuroanatomical alterations and synaptic plasticity impairment in the perirhinal cortex of the Ts65Dn mouse model of Down syndrome.Neurobiol Dis. 2017 Oct;106:89-100. doi: 10.1016/j.nbd.2017.06.017. Epub 2017 Jun 23. Neurobiol Dis. 2017. PMID: 28651891
-
On the cause of mental retardation in Down syndrome: extrapolation from full and segmental trisomy 16 mouse models.Brain Res Brain Res Rev. 2001 Apr;35(2):115-45. doi: 10.1016/s0926-6410(00)00074-4. Brain Res Brain Res Rev. 2001. PMID: 11336779 Review.
-
The GABAergic Hypothesis for Cognitive Disabilities in Down Syndrome.Front Cell Neurosci. 2017 Mar 7;11:54. doi: 10.3389/fncel.2017.00054. eCollection 2017. Front Cell Neurosci. 2017. PMID: 28326014 Free PMC article. Review.
Cited by
-
Fluoxetine increases plasticity and modulates the proteomic profile in the adult mouse visual cortex.Sci Rep. 2015 Jul 24;5:12517. doi: 10.1038/srep12517. Sci Rep. 2015. PMID: 26205348 Free PMC article.
-
Cilostazol, a Phosphodiesterase 3 Inhibitor, Moderately Attenuates Behaviors Depending on Sex in the Ts65Dn Mouse Model of Down Syndrome.Front Aging Neurosci. 2020 Apr 21;12:106. doi: 10.3389/fnagi.2020.00106. eCollection 2020. Front Aging Neurosci. 2020. PMID: 32372946 Free PMC article.
-
Disruption of Critical Period Plasticity in a Mouse Model of Neurofibromatosis Type 1.J Neurosci. 2020 Jul 8;40(28):5495-5509. doi: 10.1523/JNEUROSCI.2235-19.2020. Epub 2020 Jun 11. J Neurosci. 2020. PMID: 32527982 Free PMC article.
-
Principal Component Analysis of the Effects of Environmental Enrichment and (-)-epigallocatechin-3-gallate on Age-Associated Learning Deficits in a Mouse Model of Down Syndrome.Front Behav Neurosci. 2015 Dec 11;9:330. doi: 10.3389/fnbeh.2015.00330. eCollection 2015. Front Behav Neurosci. 2015. PMID: 26696850 Free PMC article.
-
Prospects for improving brain function in individuals with Down syndrome.CNS Drugs. 2013 Sep;27(9):679-702. doi: 10.1007/s40263-013-0089-3. CNS Drugs. 2013. PMID: 23821040 Review.
References
LinkOut - more resources
Full Text Sources
Molecular Biology Databases